Copyright
©The Author(s) 2022.
World J Gastroenterol. Jul 21, 2022; 28(27): 3455-3475
Published online Jul 21, 2022. doi: 10.3748/wjg.v28.i27.3455
Published online Jul 21, 2022. doi: 10.3748/wjg.v28.i27.3455
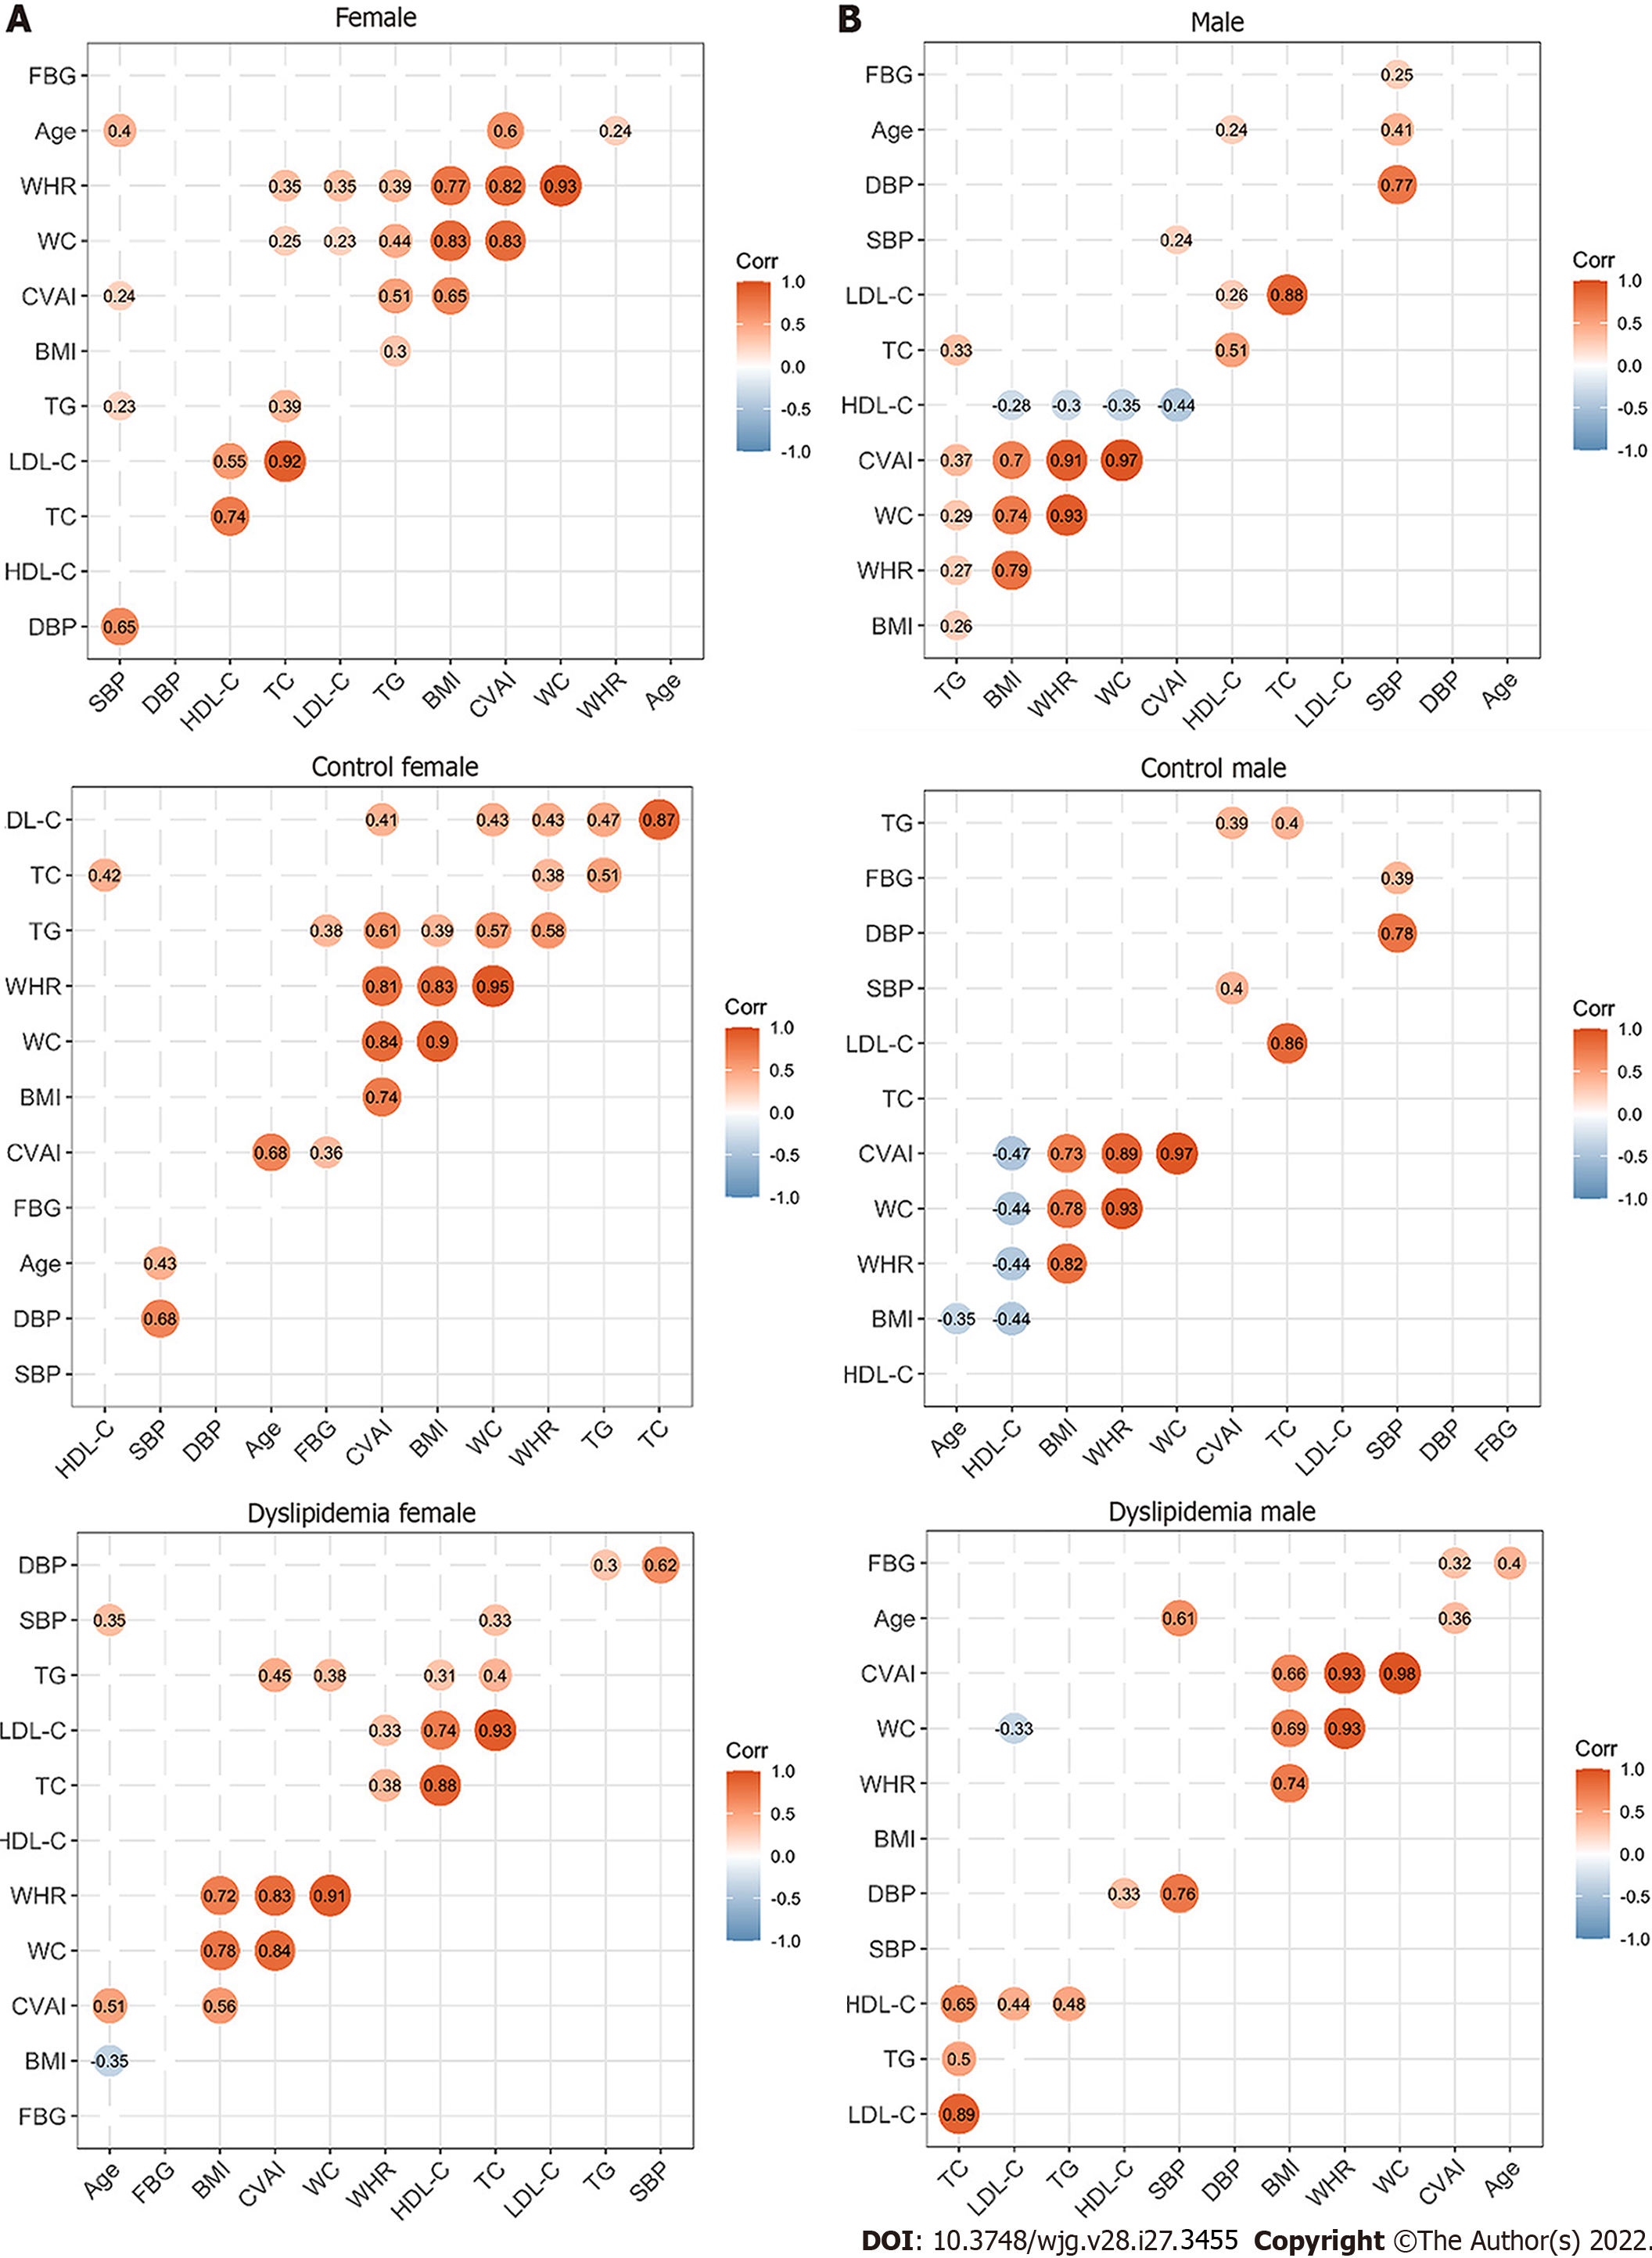
Figure 2 Correlations between the clinical characteristics in the study population.
A: Correlations between the clinical characteristics of the enrolled females; B: Correlations between the clinical characteristics of the enrolled males. The circle represents the correlation coefficient of each two parameters (P value < 0.05). The number presented in the circle is the correlation coefficient. The larger the absolute value is, the stronger the correlation is. Blue indicates a negative correlation and orange indicates a positive correlation. The depth of the color represents the strength of the correlation. The deeper the color is, the stronger the correlation is. The “ggcorrplot” package in R was utilized for Spearman’s correlation analysis. WC: Waist circumference; BMI: Body mass index; WHR: Waist circumference/height ratio; SBP: Systolic blood pressure; DBP: Diastolic blood pressure; TG: Triglyceride; TC: Total cholesterol; LDL-C: Low-density lipoprotein cholesterol; HDL-C: High-density lipoprotein cholesterol; CVAI: Chinese visceral adiposity index.
- Citation: Guo L, Wang YY, Wang JH, Zhao HP, Yu Y, Wang GD, Dai K, Yan YZ, Yang YJ, Lv J. Associations of gut microbiota with dyslipidemia based on sex differences in subjects from Northwestern China. World J Gastroenterol 2022; 28(27): 3455-3475
- URL: https://www.wjgnet.com/1007-9327/full/v28/i27/3455.htm
- DOI: https://dx.doi.org/10.3748/wjg.v28.i27.3455


