Copyright
©The Author(s) 2022.
World J Gastroenterol. Jun 14, 2022; 28(22): 2437-2456
Published online Jun 14, 2022. doi: 10.3748/wjg.v28.i22.2437
Published online Jun 14, 2022. doi: 10.3748/wjg.v28.i22.2437
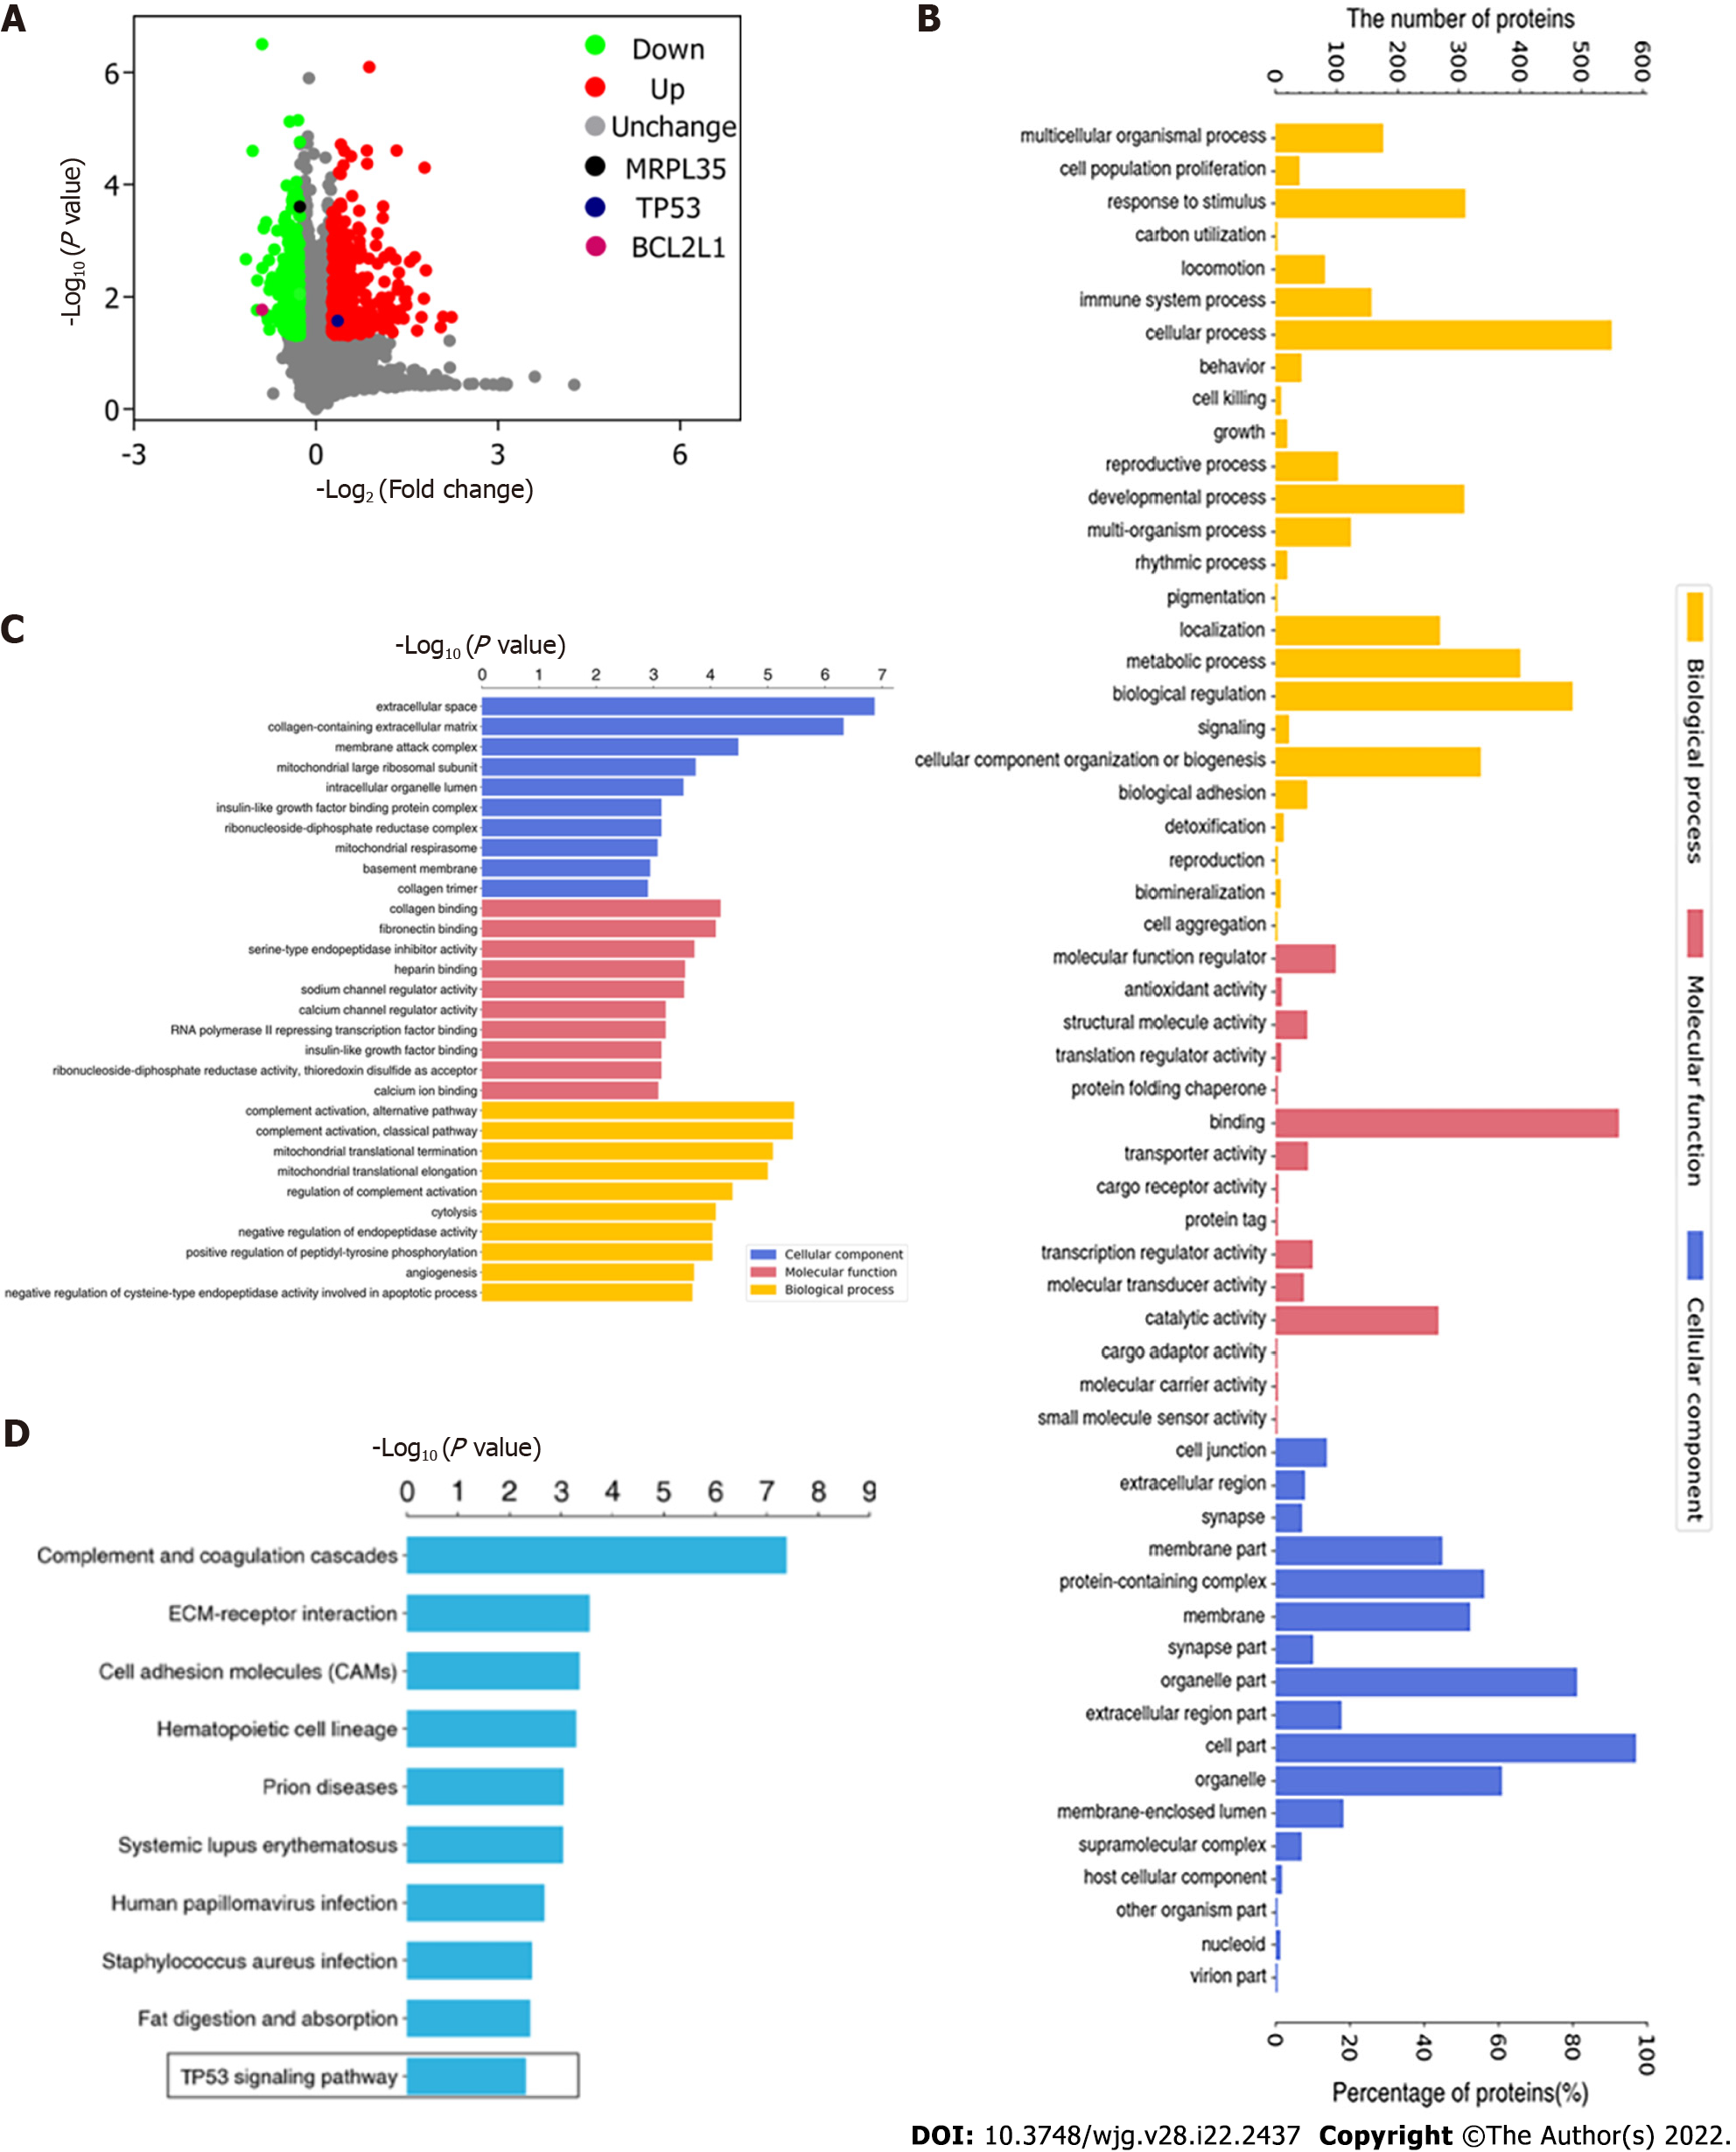
Figure 9 Volcano plot of differentially expressed proteins and Gene Ontology annotation analysis.
A: Volcano plot of differentially expressed proteins (DEPs). The horizontal axis is the relative quantitative value of protein after log2 conversion, and the vertical axis is the P value of difference significance test after -log10 conversion; B: Gene Ontology (GO) annotation analysis of DEPs. The number of DEPs categorized as biological processes, molecular functions, and cellular components; C: GO enrichment analysis of DEPs. The Y axis denotes the GO functional classification enriched by the DEPs, and the X axis denotes the −log10 of the P value of Fisher’s exact test of the significance of the enrichment; D: KEGG pathway enrichment analysis. The Y axis denotes the categories of KEGG pathways. The X axis is the −log10 of the P value of Fisher’s exact test of the significance of enrichment.
- Citation: Yuan L, Yang Y, Li X, Zhou X, Du YH, Liu WJ, Zhang L, Yu L, Ma TT, Li JX, Chen Y, Nan Y. 18β-glycyrrhetinic acid regulates mitochondrial ribosomal protein L35-associated apoptosis signaling pathways to inhibit proliferation of gastric carcinoma cells. World J Gastroenterol 2022; 28(22): 2437-2456
- URL: https://www.wjgnet.com/1007-9327/full/v28/i22/2437.htm
- DOI: https://dx.doi.org/10.3748/wjg.v28.i22.2437


