Copyright
©The Author(s) 2022.
World J Gastroenterol. Jun 7, 2022; 28(21): 2320-2333
Published online Jun 7, 2022. doi: 10.3748/wjg.v28.i21.2320
Published online Jun 7, 2022. doi: 10.3748/wjg.v28.i21.2320
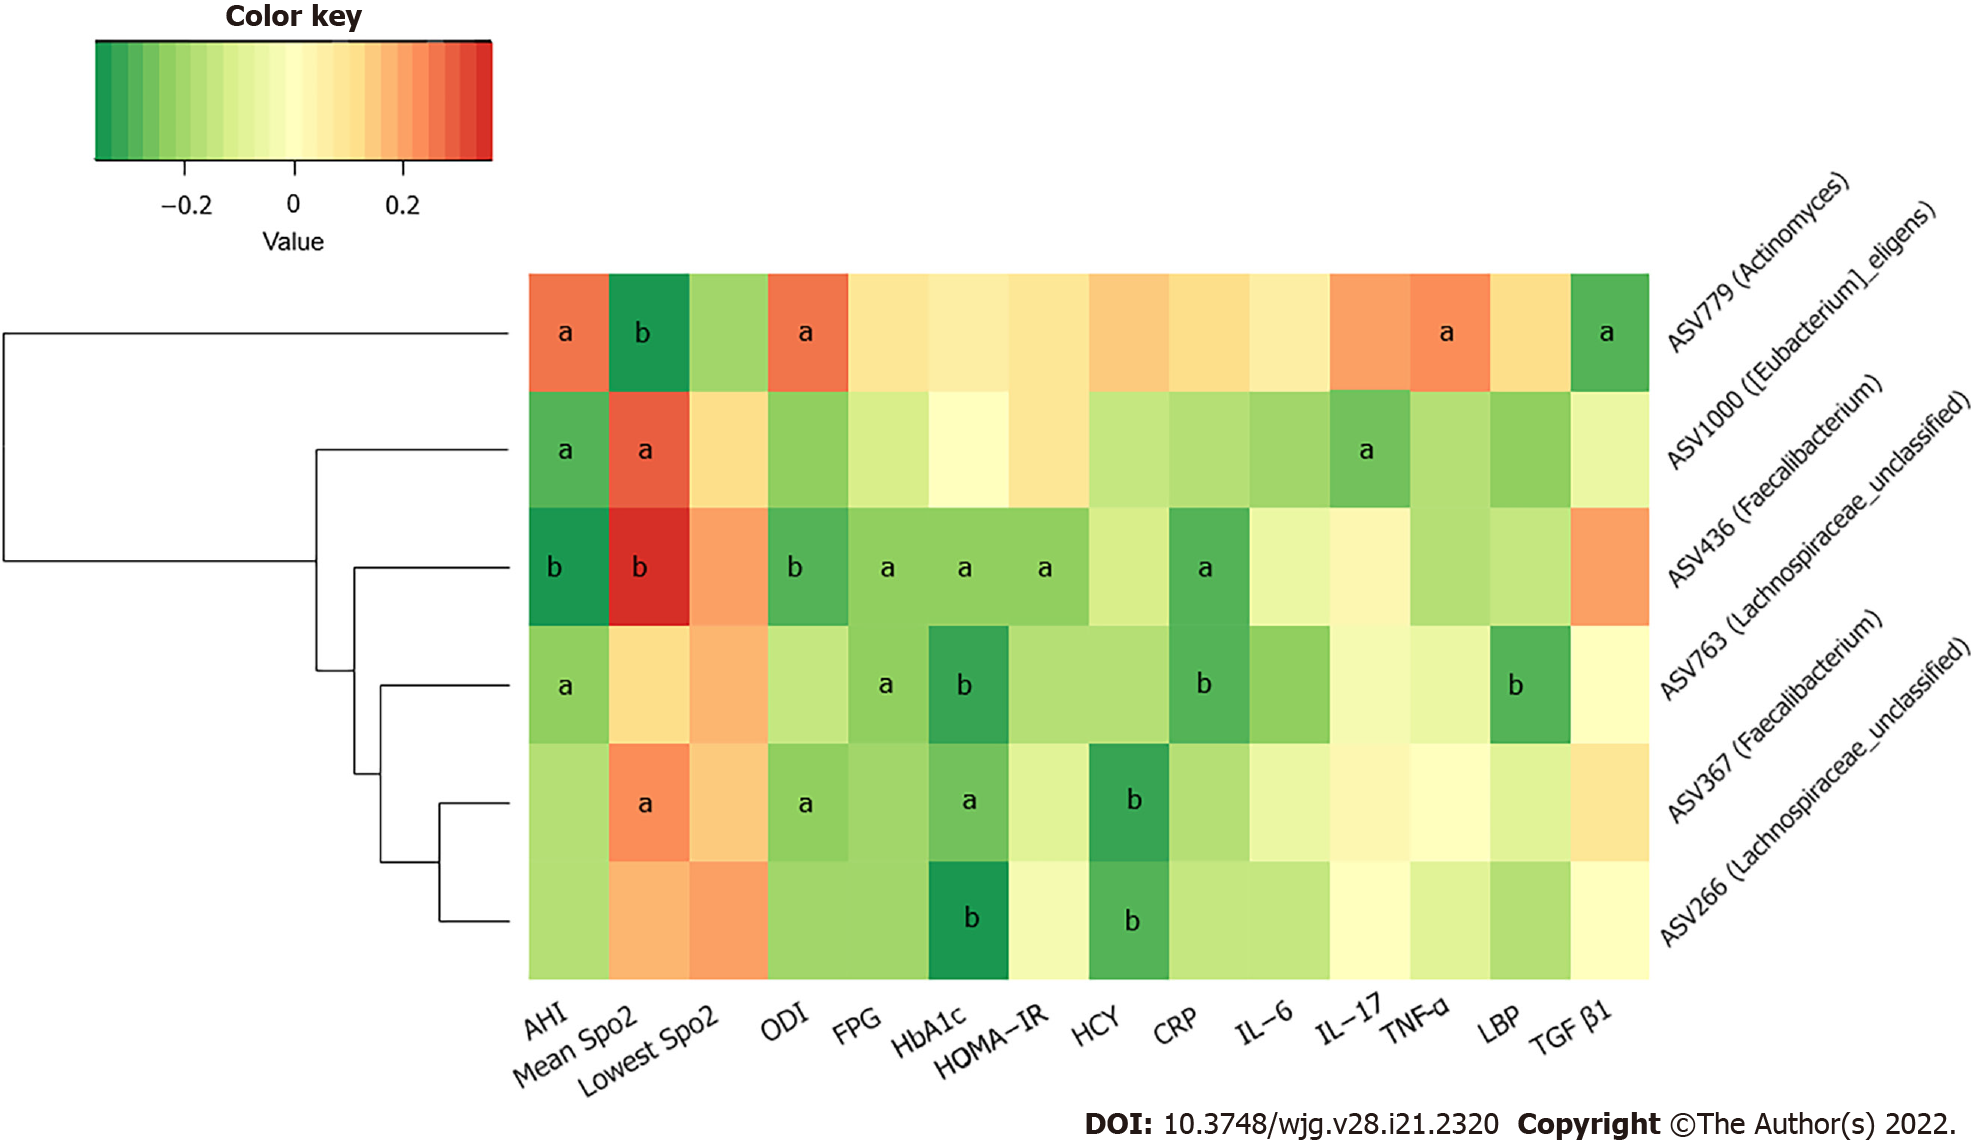
Figure 6 Heatmap of correlation among key amplicon sequence variants of gut microbiota and metabolic and inflammatory indicators.
The color of the cells represents the Spearman’s correlation coefficient between each amplicon sequence variant and clinical parameter. aP < 0.05; bP < 0.01.
- Citation: Tang SS, Liang CH, Liu YL, Wei W, Deng XR, Shi XY, Wang LM, Zhang LJ, Yuan HJ. Intermittent hypoxia is involved in gut microbial dysbiosis in type 2 diabetes mellitus and obstructive sleep apnea-hypopnea syndrome. World J Gastroenterol 2022; 28(21): 2320-2333
- URL: https://www.wjgnet.com/1007-9327/full/v28/i21/2320.htm
- DOI: https://dx.doi.org/10.3748/wjg.v28.i21.2320


