Copyright
©The Author(s) 2022.
World J Gastroenterol. Jun 7, 2022; 28(21): 2320-2333
Published online Jun 7, 2022. doi: 10.3748/wjg.v28.i21.2320
Published online Jun 7, 2022. doi: 10.3748/wjg.v28.i21.2320
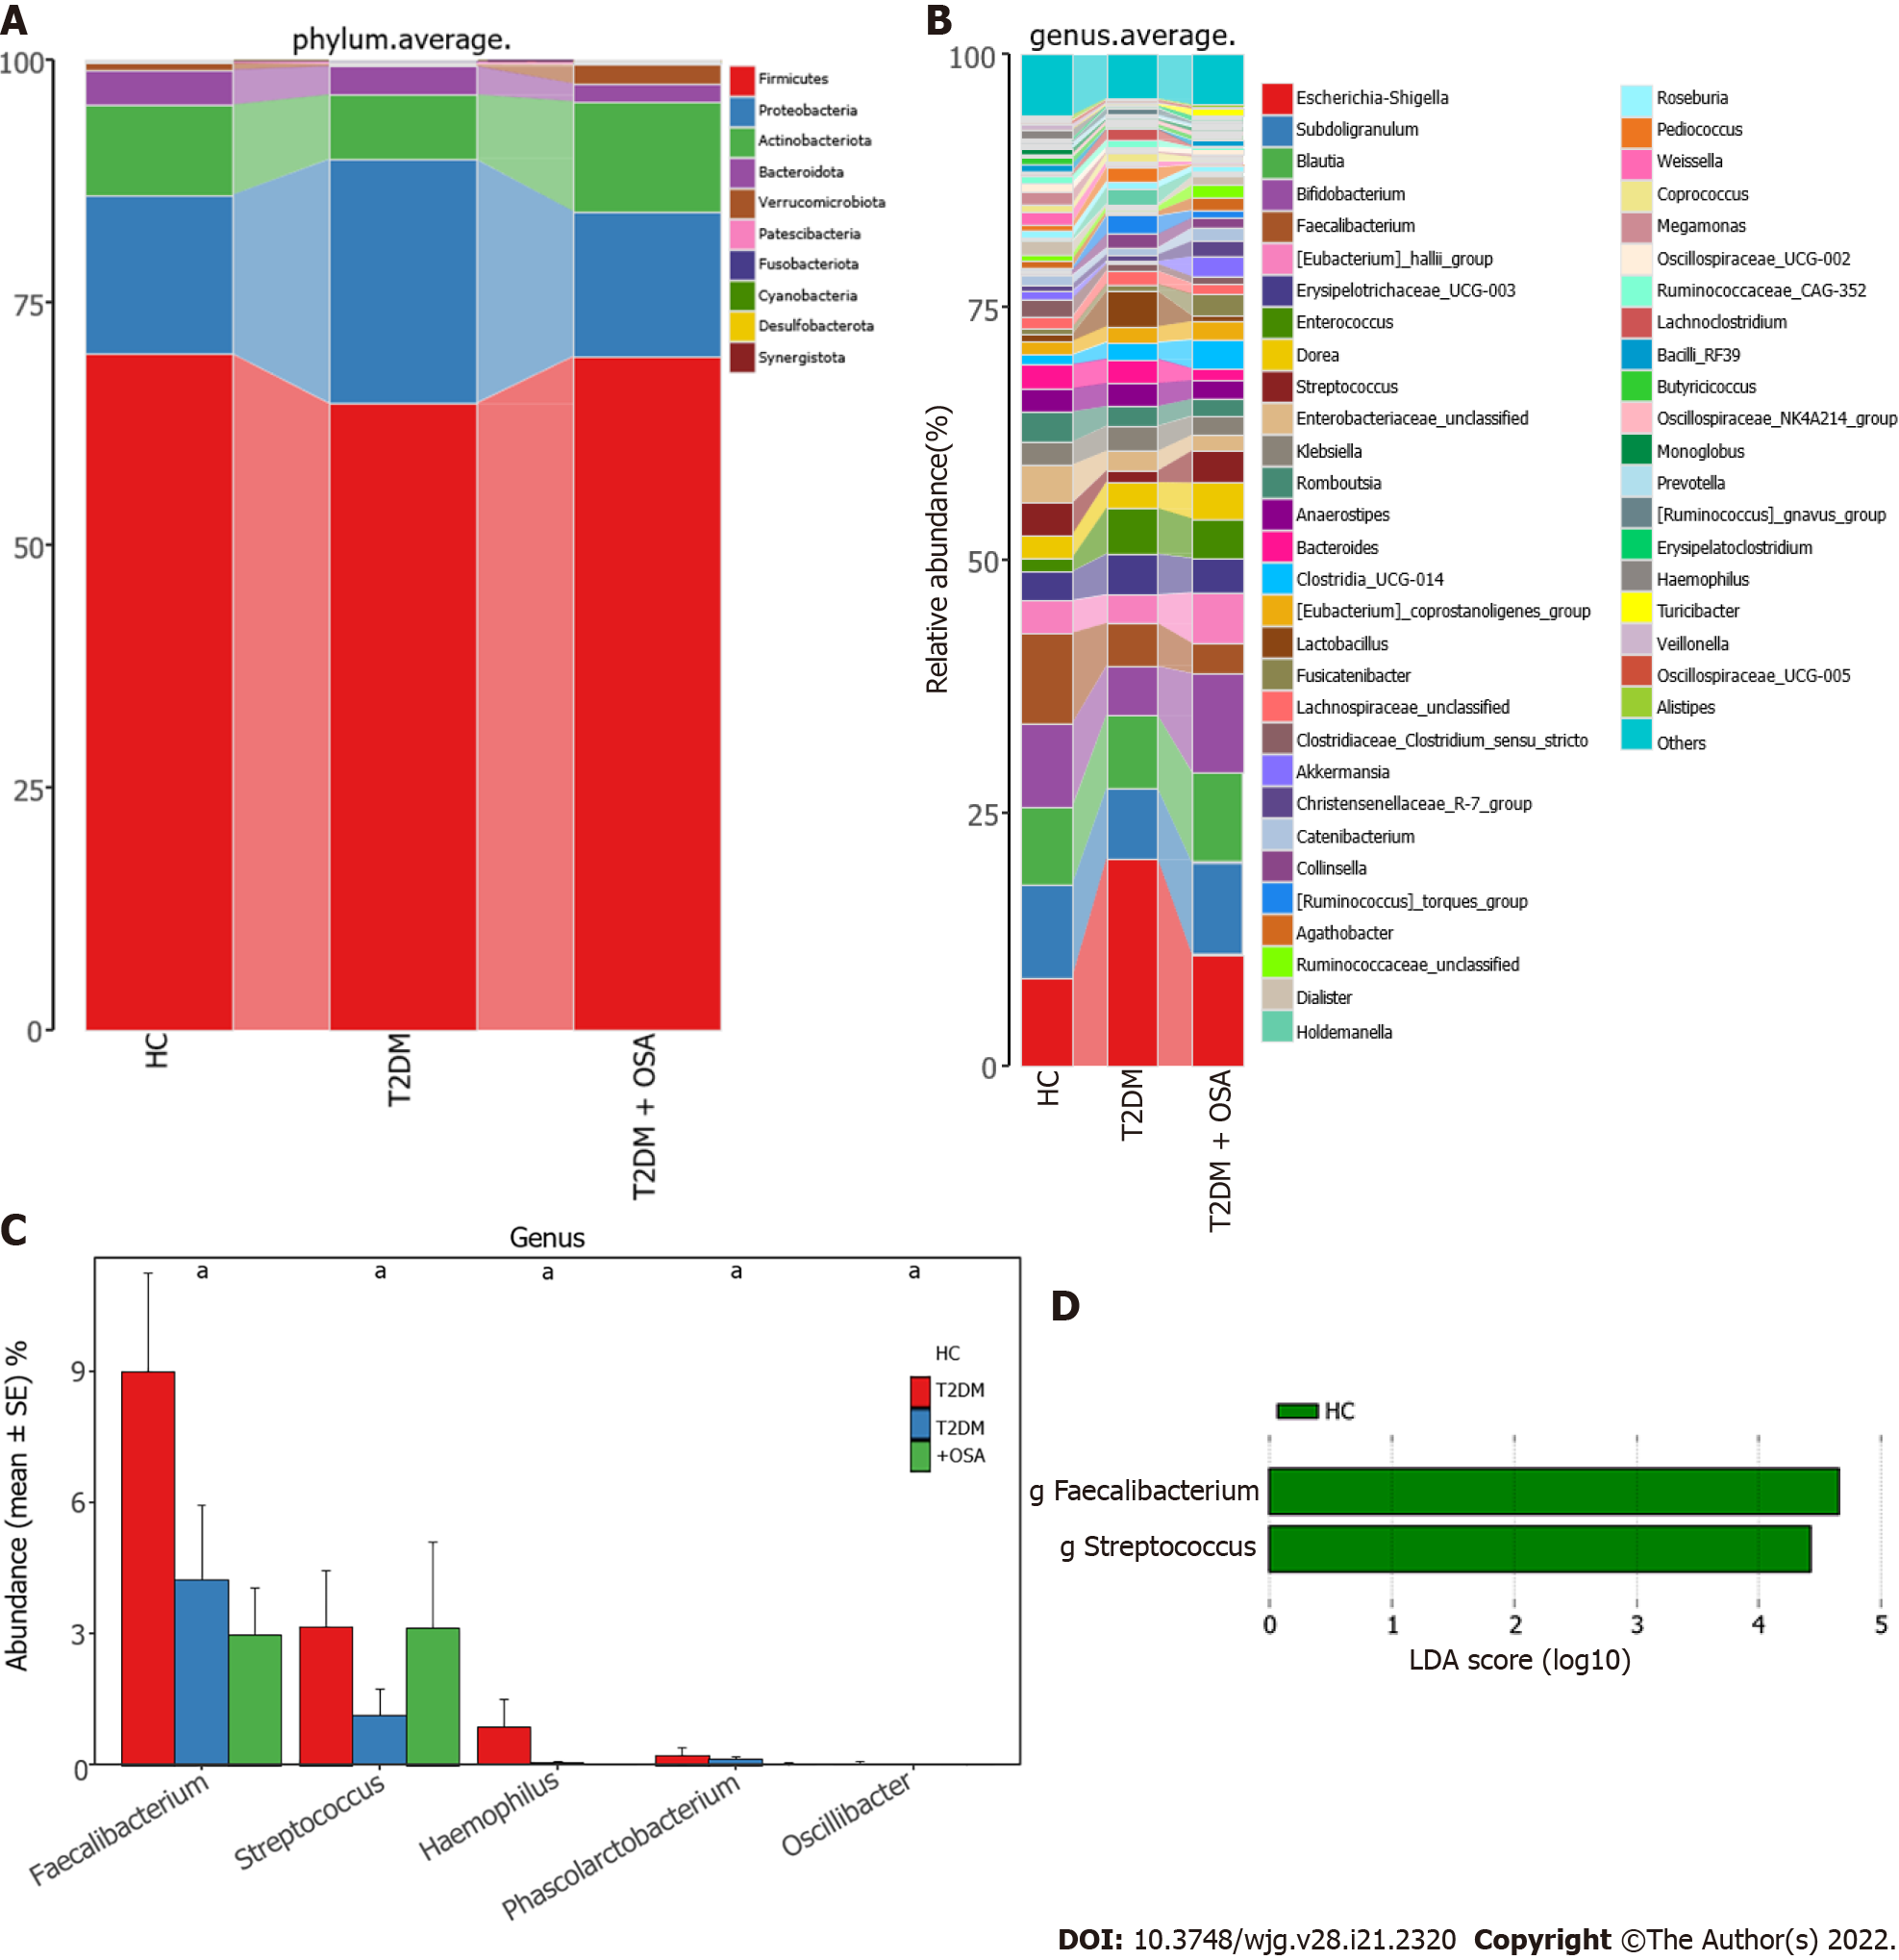
Figure 4 Average compositions and relative abundance of the bacterial community among three groups at different levels.
A: Average relative abundance histogram of dominant species composition stratified by group at the phylum levels; B: Average relative abundance histogram of dominant species composition stratified by group at the genus levels; C: Histograms for genera with significant differences. Bar chart showing the mean ± SE of each group; D: Linear discriminant analysis analysis column diagram. LDA: Linear discriminant analysis. aP < 0.05. Significant difference shown by the Kruskal–Wallis rank-sum test.
- Citation: Tang SS, Liang CH, Liu YL, Wei W, Deng XR, Shi XY, Wang LM, Zhang LJ, Yuan HJ. Intermittent hypoxia is involved in gut microbial dysbiosis in type 2 diabetes mellitus and obstructive sleep apnea-hypopnea syndrome. World J Gastroenterol 2022; 28(21): 2320-2333
- URL: https://www.wjgnet.com/1007-9327/full/v28/i21/2320.htm
- DOI: https://dx.doi.org/10.3748/wjg.v28.i21.2320


