Copyright
©The Author(s) 2022.
World J Gastroenterol. May 14, 2022; 28(18): 1981-1995
Published online May 14, 2022. doi: 10.3748/wjg.v28.i18.1981
Published online May 14, 2022. doi: 10.3748/wjg.v28.i18.1981
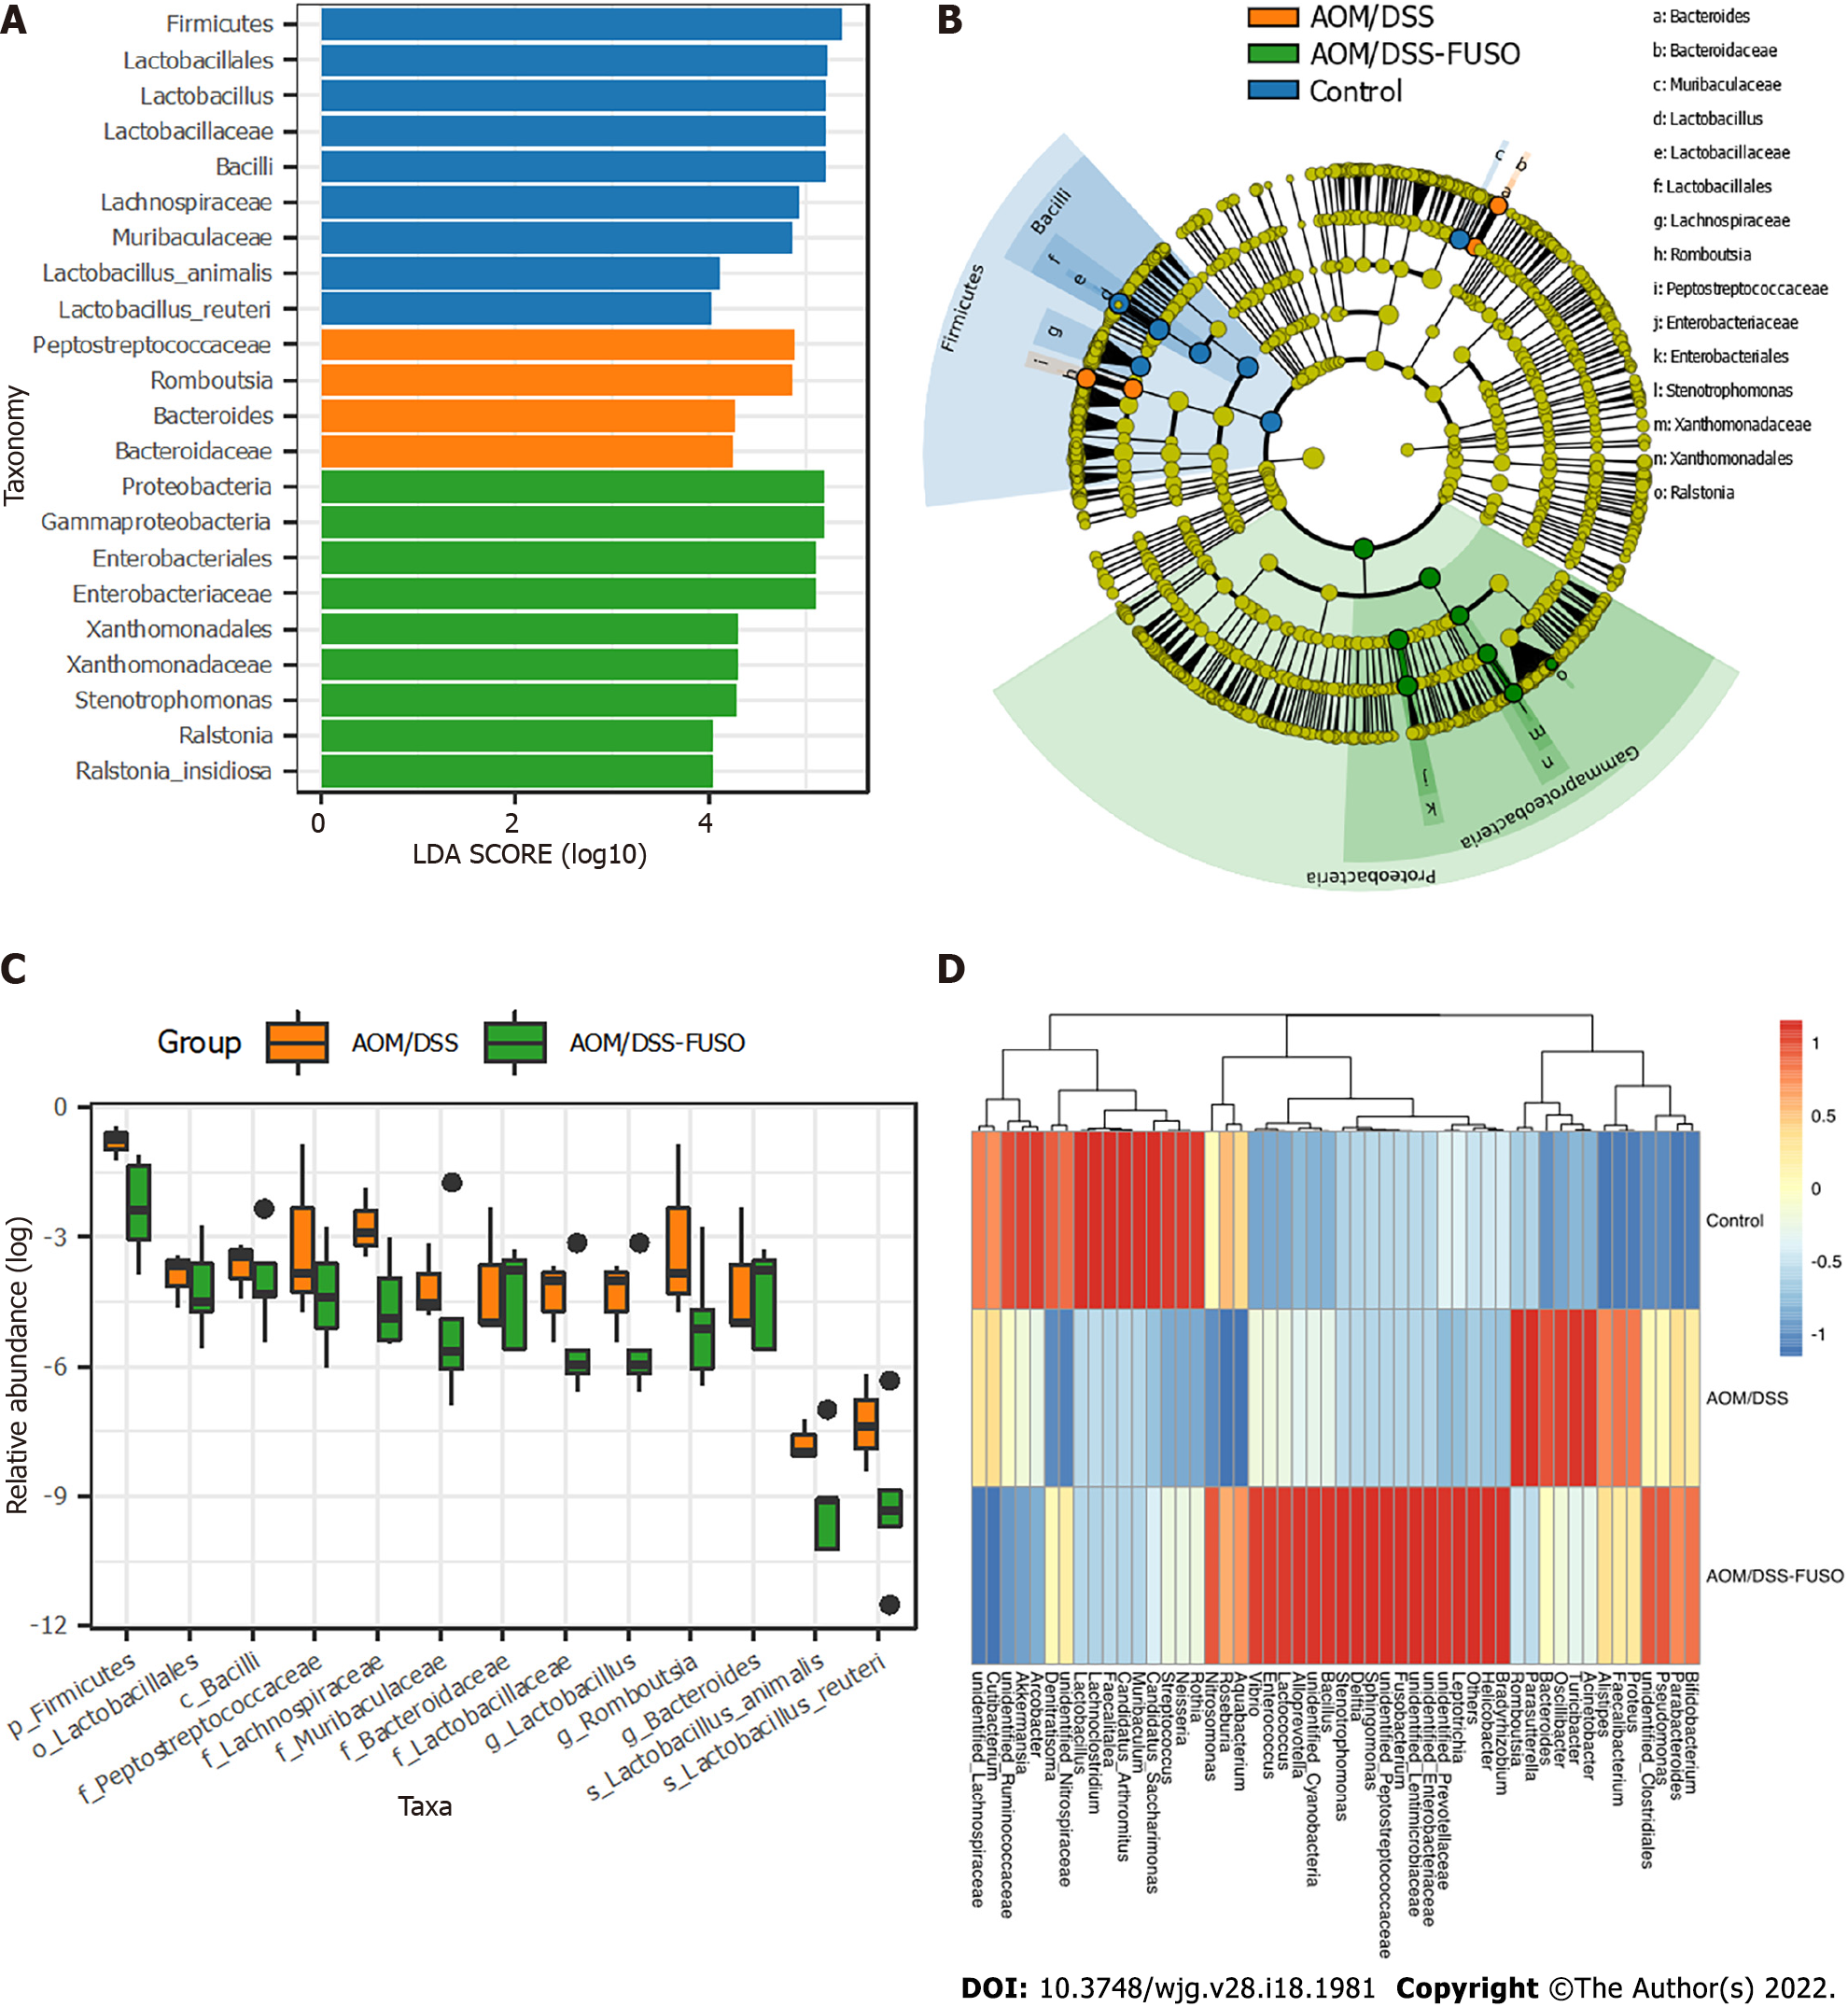
Figure 3 The differentially abundant taxa among the three groups.
A: Histogram of the linear discriminant analysis scores computed for taxa that were differentially abundant among the three groups; B: Taxonomic representation of statistically and biologically consistent differences among the three groups. The differences are represented in the color of the most abundant class; C: Relative abundance of the taxa in azoxymethane/dextran sulfate sodium salt (AOM/DSS)-FUSO and AOM/DSS; D: Patterns of the abundance of the top 50 operational taxonomic units in all samples. The colors indicate the Z scores of the mean abundance in each group. AOM: Azoxymethane; DSS: Dextran sulfate sodium salt.
- Citation: Wu N, Feng YQ, Lyu N, Wang D, Yu WD, Hu YF. Fusobacterium nucleatum promotes colon cancer progression by changing the mucosal microbiota and colon transcriptome in a mouse model. World J Gastroenterol 2022; 28(18): 1981-1995
- URL: https://www.wjgnet.com/1007-9327/full/v28/i18/1981.htm
- DOI: https://dx.doi.org/10.3748/wjg.v28.i18.1981


