Copyright
©The Author(s) 2022.
World J Gastroenterol. May 7, 2022; 28(17): 1751-1767
Published online May 7, 2022. doi: 10.3748/wjg.v28.i17.1751
Published online May 7, 2022. doi: 10.3748/wjg.v28.i17.1751
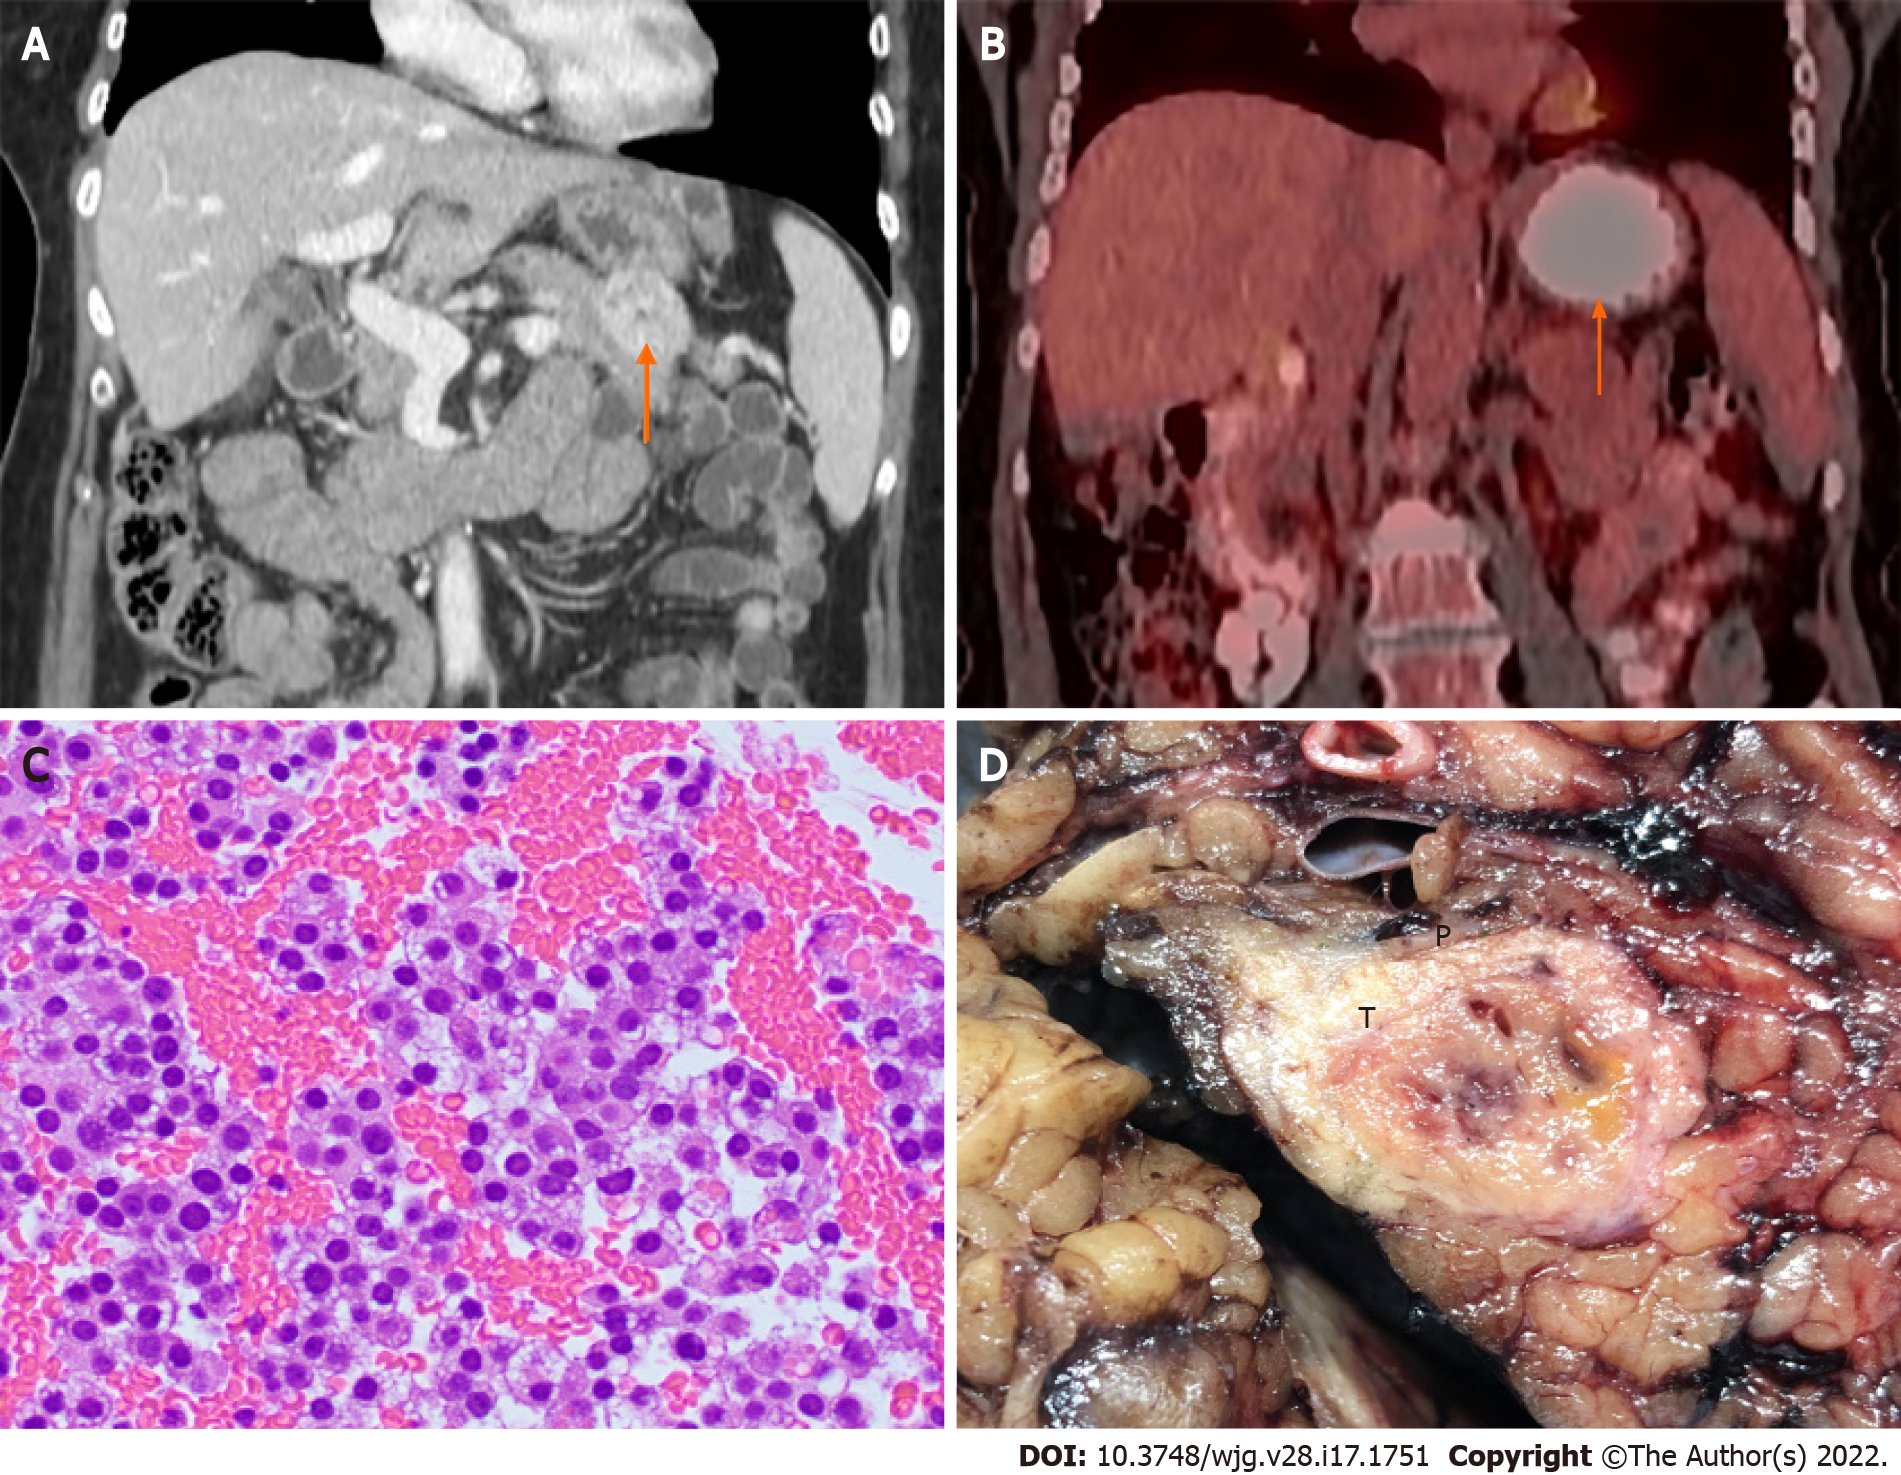
Figure 4 Pancreatic neuroendocrine tumor.
A: Computed tomography (CT) image showing a 3.5 cm distal pancreatic mass (arrow); B: Positron emission tomography-CT image showing a pancreatic mass with hypermetabolic activity (SUVmax = 4.3) (arrow); C: Endoscopic ultrasound-guided fine-needle aspiration showing clusters of neuroendocrine tumor cells with round nuclei and fine stippled “salt-and-pepper” chromatin (H&E stain, 400 ×); D: Distal pancreatectomy showing the gross cut surface of a firm fibrotic pancreatic neuroendocrine tumor (T) with focal hemorrhage.
- Citation: Yin F, Wu ZH, Lai JP. New insights in diagnosis and treatment of gastroenteropancreatic neuroendocrine neoplasms. World J Gastroenterol 2022; 28(17): 1751-1767
- URL: https://www.wjgnet.com/1007-9327/full/v28/i17/1751.htm
- DOI: https://dx.doi.org/10.3748/wjg.v28.i17.1751


