Copyright
©The Author(s) 2022.
World J Gastroenterol. Apr 28, 2022; 28(16): 1625-1640
Published online Apr 28, 2022. doi: 10.3748/wjg.v28.i16.1625
Published online Apr 28, 2022. doi: 10.3748/wjg.v28.i16.1625
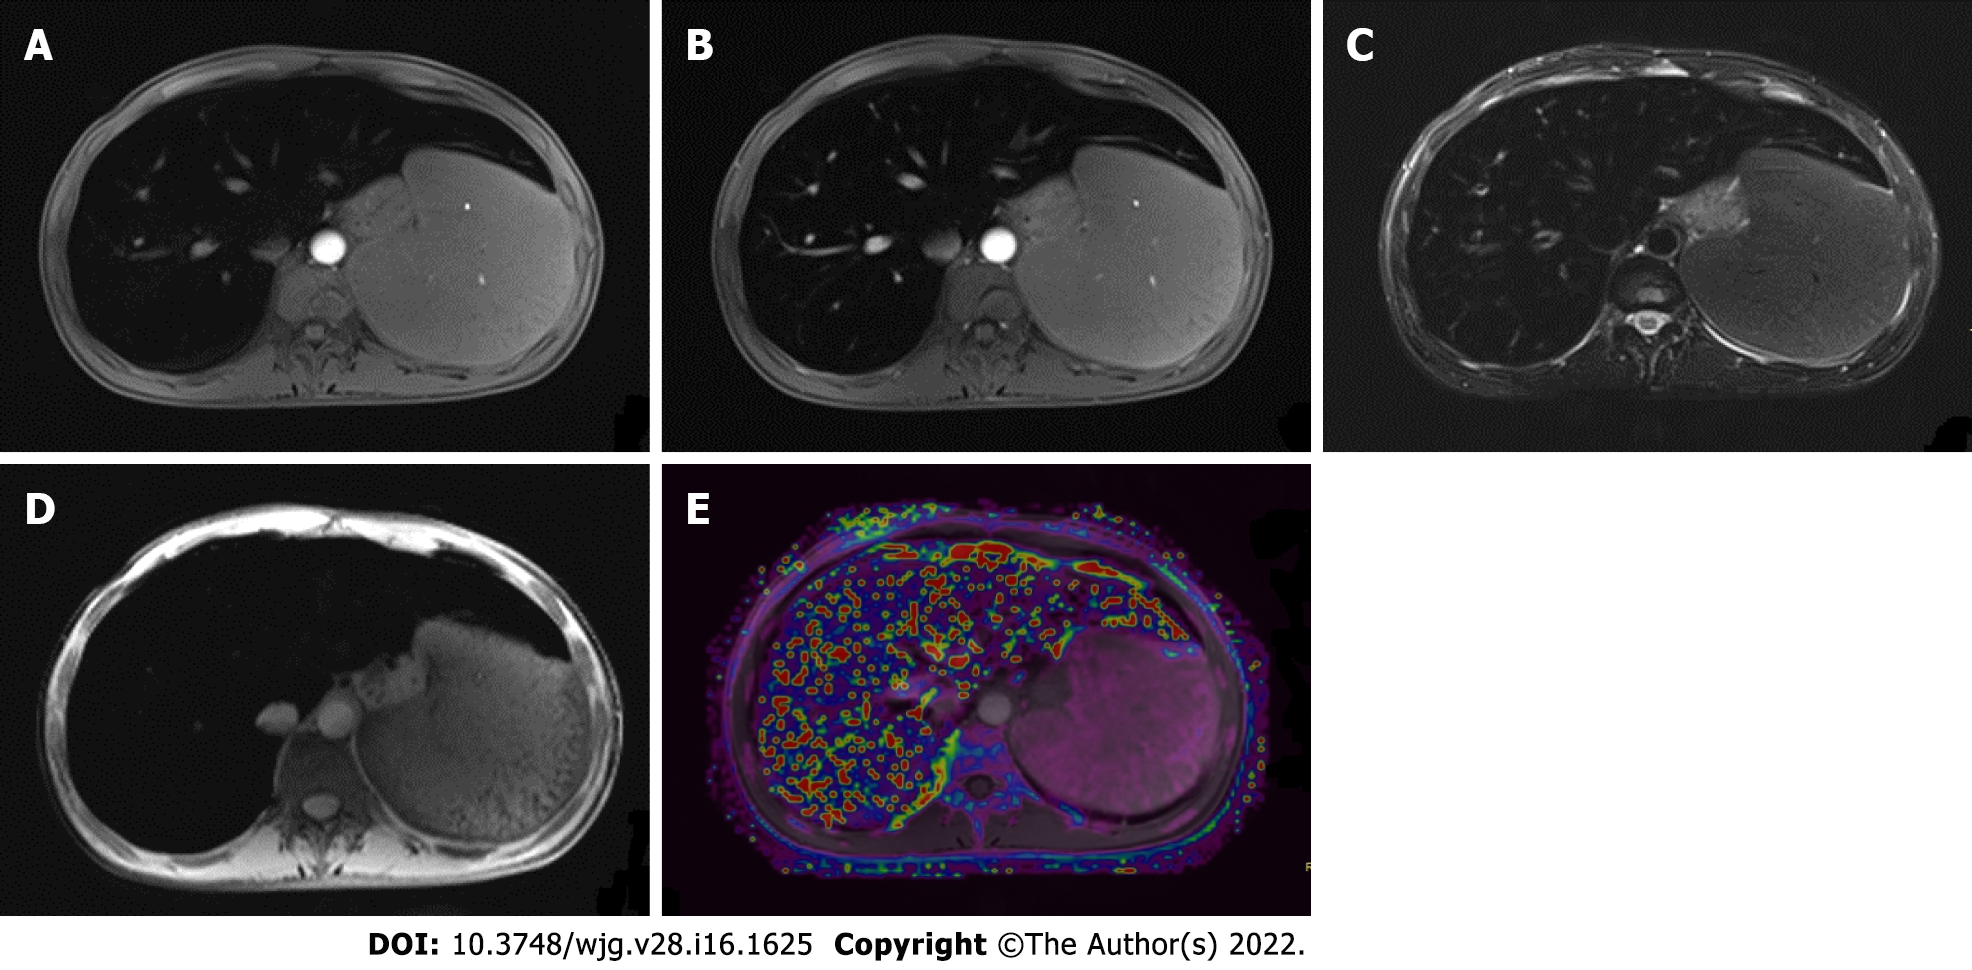
Figure 5 Magnetic resonance images of a 26-year-old man with hemochromatosis.
Pre-contrast T1-weighted image (A), portal venous phase T1-weighted image (B), T2-weighted image (C), and SWI image (D) showed signal intensity in liver parenchyma, while R2* mapping (E) shows increased signal intensity in the liver, demonstrating severe iron overload. R2: Relaxation rate.
- Citation: Duan T, Jiang HY, Ling WW, Song B. Noninvasive imaging of hepatic dysfunction: A state-of-the-art review. World J Gastroenterol 2022; 28(16): 1625-1640
- URL: https://www.wjgnet.com/1007-9327/full/v28/i16/1625.htm
- DOI: https://dx.doi.org/10.3748/wjg.v28.i16.1625


