Copyright
©The Author(s) 2022.
World J Gastroenterol. Apr 14, 2022; 28(14): 1479-1493
Published online Apr 14, 2022. doi: 10.3748/wjg.v28.i14.1479
Published online Apr 14, 2022. doi: 10.3748/wjg.v28.i14.1479
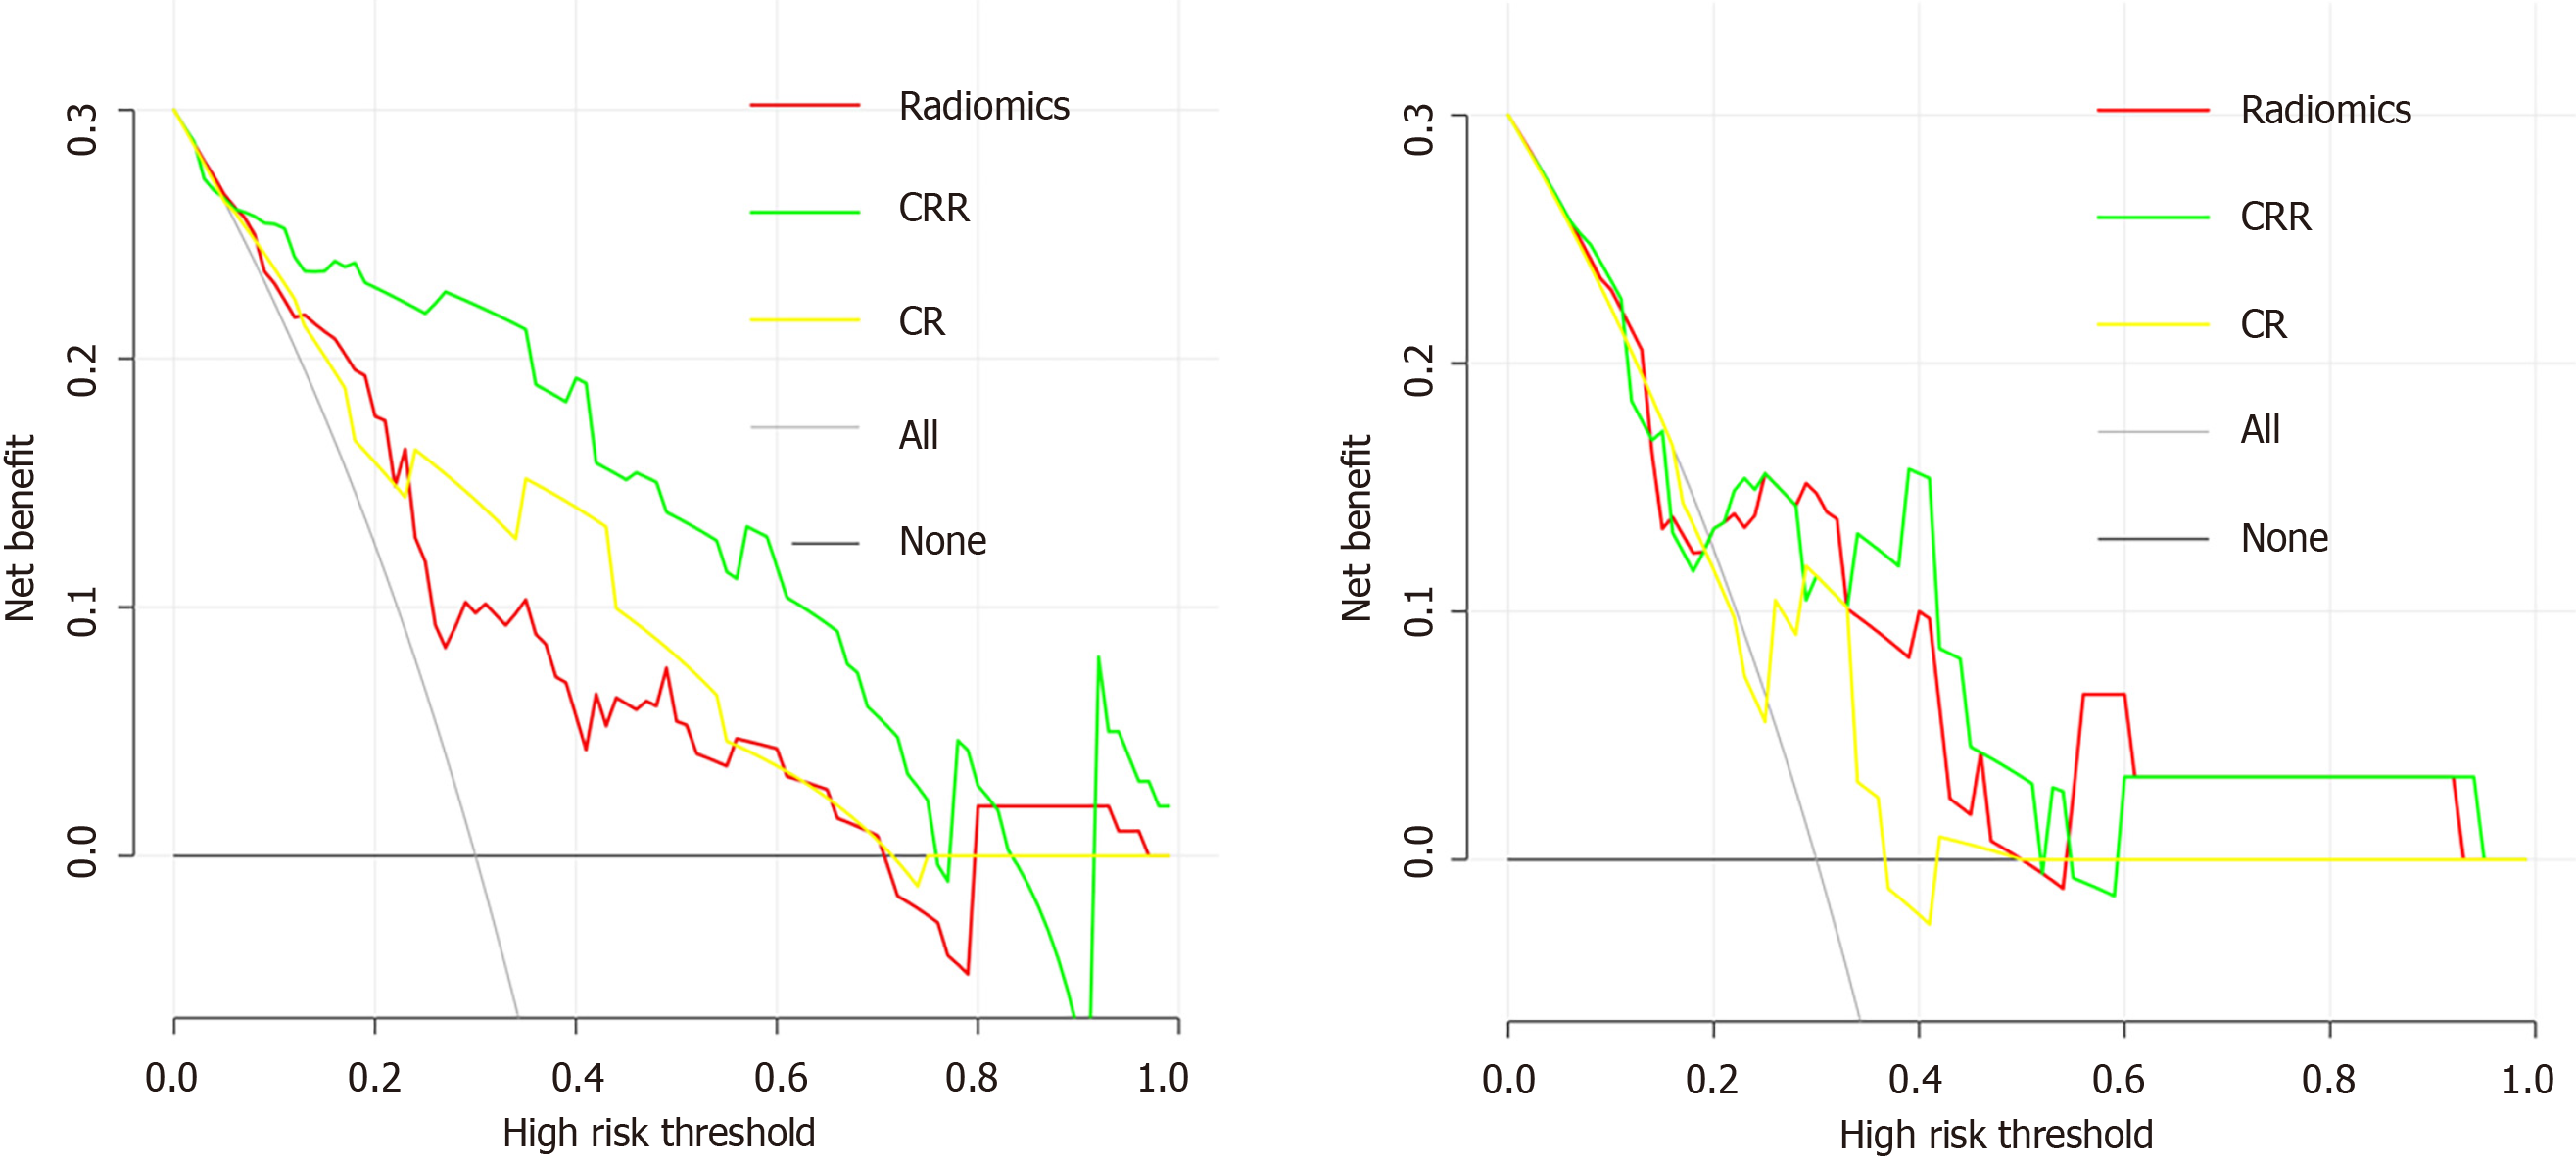
Figure 4 Decision curve analysis for each model.
A: Decision curve analysis in the training cohort; B: Decision curve analysis in the validation cohort. The y-axis measures the net benefit, and the x-axis is the threshold probability. The gray line represents the hypothesis that all patients are β-arrestin1 phosphorylation-positive. The black line represents the hypothesis that all patients are β-arrestin1 phosphorylation-negative. Among the three models, the clinico-radiological-radiomics (CRR) model provided the highest net benefit compared with the radiomics and clinico-radiological (CR) models.
- Citation: Che F, Xu Q, Li Q, Huang ZX, Yang CW, Wang LY, Wei Y, Shi YJ, Song B. Radiomics signature: A potential biomarker for β-arrestin1 phosphorylation prediction in hepatocellular carcinoma. World J Gastroenterol 2022; 28(14): 1479-1493
- URL: https://www.wjgnet.com/1007-9327/full/v28/i14/1479.htm
- DOI: https://dx.doi.org/10.3748/wjg.v28.i14.1479


