Copyright
©The Author(s) 2022.
World J Gastroenterol. Apr 14, 2022; 28(14): 1444-1454
Published online Apr 14, 2022. doi: 10.3748/wjg.v28.i14.1444
Published online Apr 14, 2022. doi: 10.3748/wjg.v28.i14.1444
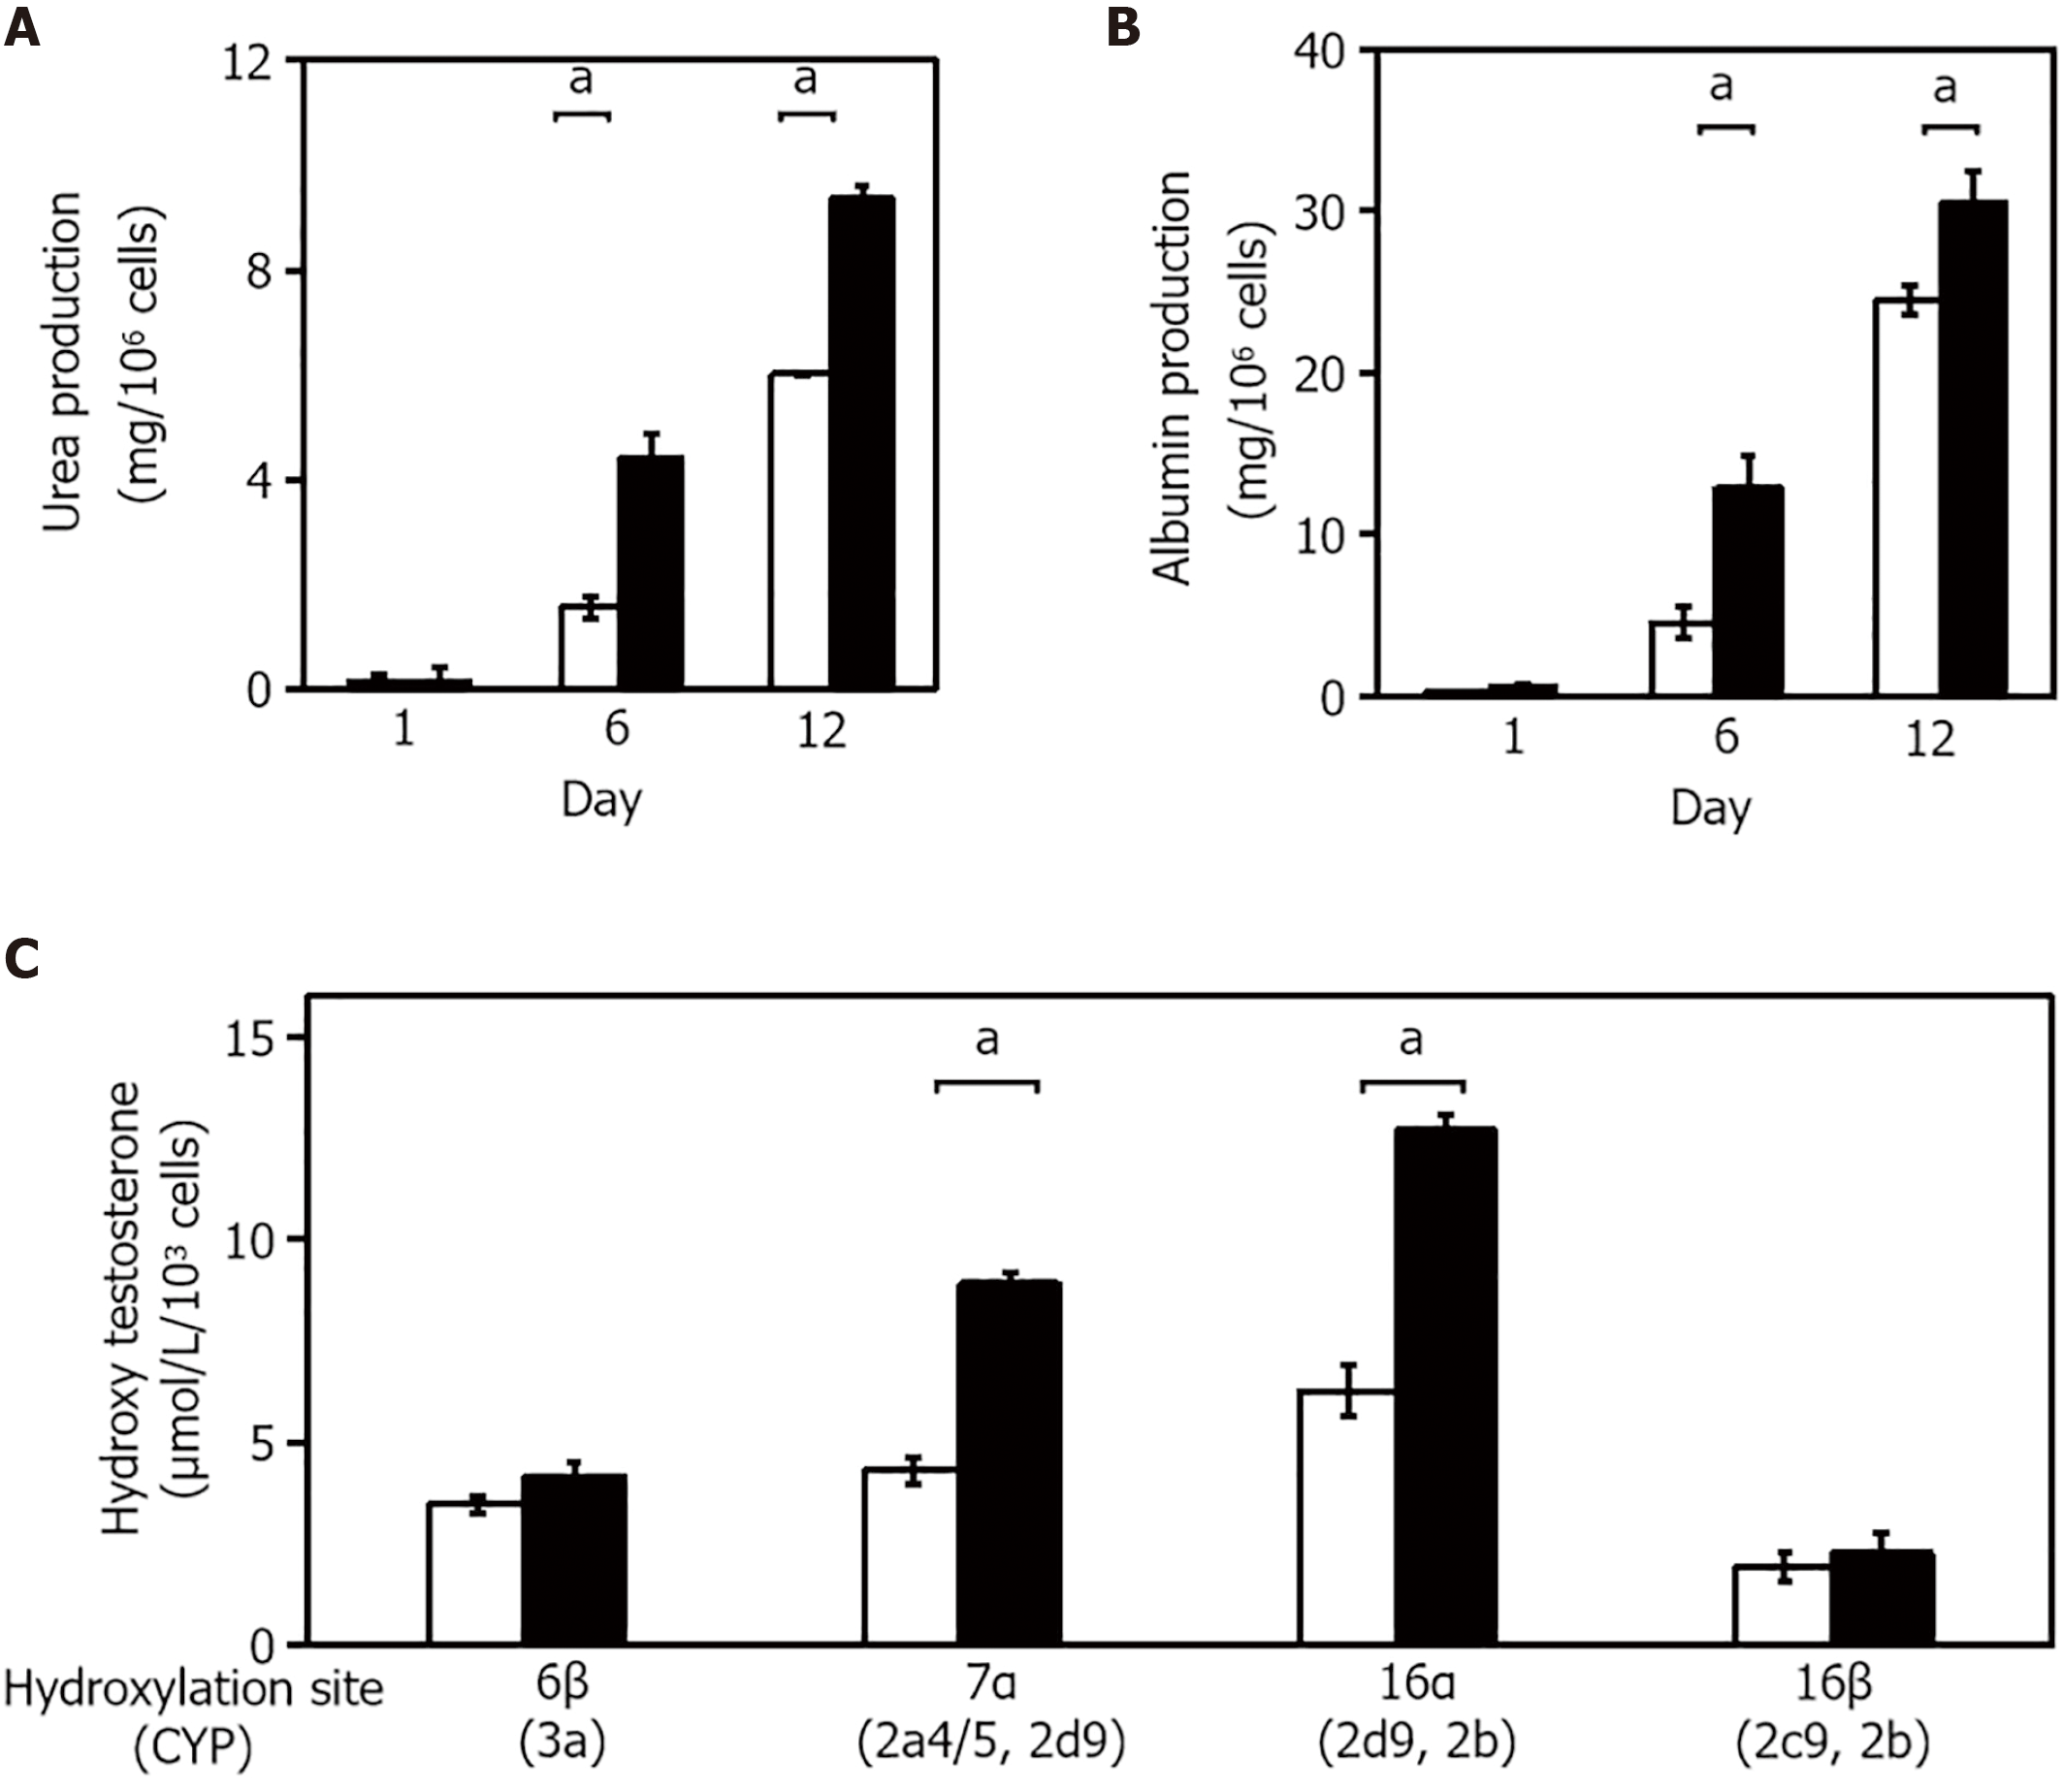
Figure 3 Validation of hepatic functions in the three-dimensional liver tissue culture model.
A and B: Urea (A) and albumin (B) production levels in the culture medium in each culture condition; C: Hydroxylation activity of testosterone in the three-dimensional (3-D) liver tissue culture model. The amount of each hydroxylated testosterone in culture medium. Culture medium was changed every 2 d over the course of the measurement period. 2-D culture (open columns) and 3-D culture (closed columns) system. Statistical comparisons were made using the Welch t-test. Data are shown as means ± SE, n = 3, aP < 0.01.
- Citation: Tamai M, Adachi E, Kawase M, Tagawa YI. Syngeneic implantation of mouse hepatic progenitor cell-derived three-dimensional liver tissue with dense collagen fibrils. World J Gastroenterol 2022; 28(14): 1444-1454
- URL: https://www.wjgnet.com/1007-9327/full/v28/i14/1444.htm
- DOI: https://dx.doi.org/10.3748/wjg.v28.i14.1444


