Copyright
©The Author(s) 2022.
World J Gastroenterol. Apr 14, 2022; 28(14): 1444-1454
Published online Apr 14, 2022. doi: 10.3748/wjg.v28.i14.1444
Published online Apr 14, 2022. doi: 10.3748/wjg.v28.i14.1444
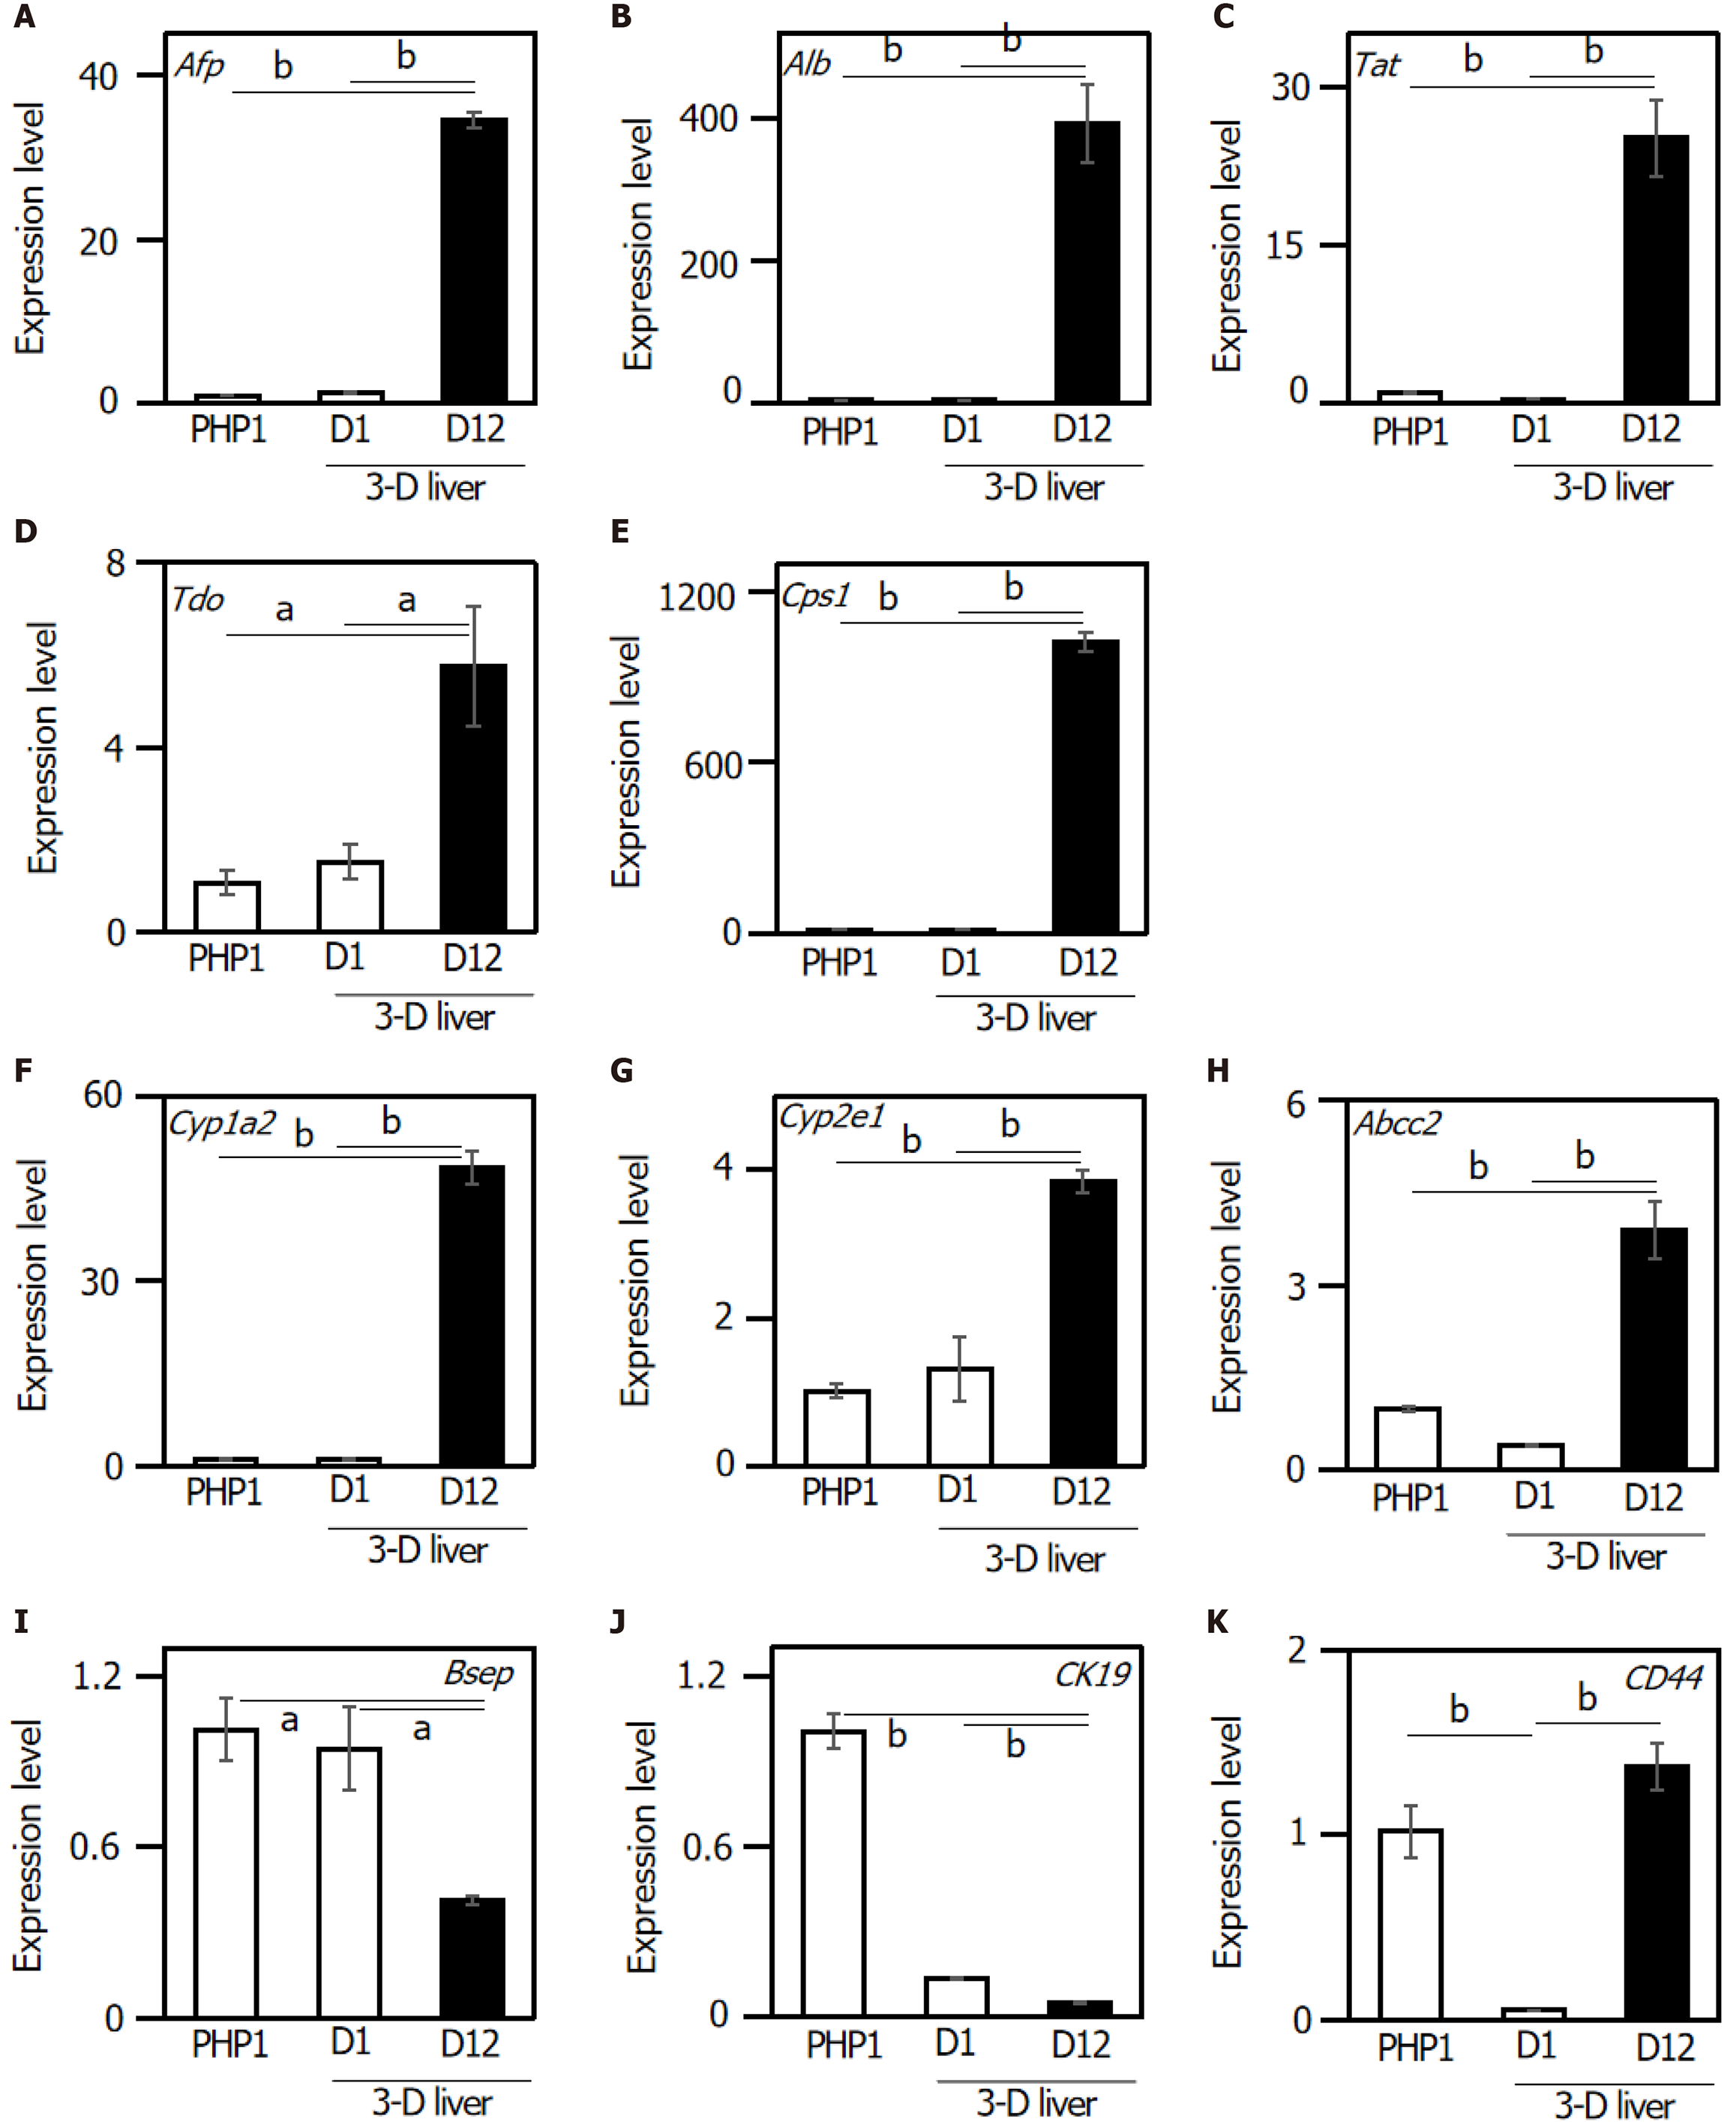
Figure 2 Relative gene expression levels in the three-dimensional liver tissue culture model cultured in a bioreactor on day 1 and day 12.
Relative gene expression levels were analyzed in the three-dimensional liver tissue culture model. A: Afp; B: Albumin; C: Tat; D: Tdo; E: Cps1; F: Cyp1a2; G: Cyp2e1; H: Abcc2; I: Bsep; J: CK19; K: CD44. Hprt was used as an internal control. Statistical comparisons were made using the Tukey-Kramer method. Data are shown as means ± SE, n = 3, aP < 0.05 and bP < 0.01. Afp: Alpha-fetoprotein; Tat: Tyrosine aminotransferase; Tdo: Tryptophan 2,3-dioxygenase; Cps1: Carbamoyl-phosphate synthetase 1; Cyp1a2: Cytochrome P450, family 1, sub-family a2; Cyp2e1: Cytochrome P450, family 2, sub-family e1; Abcc2: ATP-binding cassette, sub-family C (CFTR/MRP), member 2; Bsep: Bile salt export pump; ABCB11: ATP-binding cassette, sub-family B member 11; CK19: Cytokeratin 19; CD44: Hyaluronic Acid Binding Protein.
- Citation: Tamai M, Adachi E, Kawase M, Tagawa YI. Syngeneic implantation of mouse hepatic progenitor cell-derived three-dimensional liver tissue with dense collagen fibrils. World J Gastroenterol 2022; 28(14): 1444-1454
- URL: https://www.wjgnet.com/1007-9327/full/v28/i14/1444.htm
- DOI: https://dx.doi.org/10.3748/wjg.v28.i14.1444


