Copyright
©The Author(s) 2022.
World J Gastroenterol. Mar 28, 2022; 28(12): 1220-1225
Published online Mar 28, 2022. doi: 10.3748/wjg.v28.i12.1220
Published online Mar 28, 2022. doi: 10.3748/wjg.v28.i12.1220
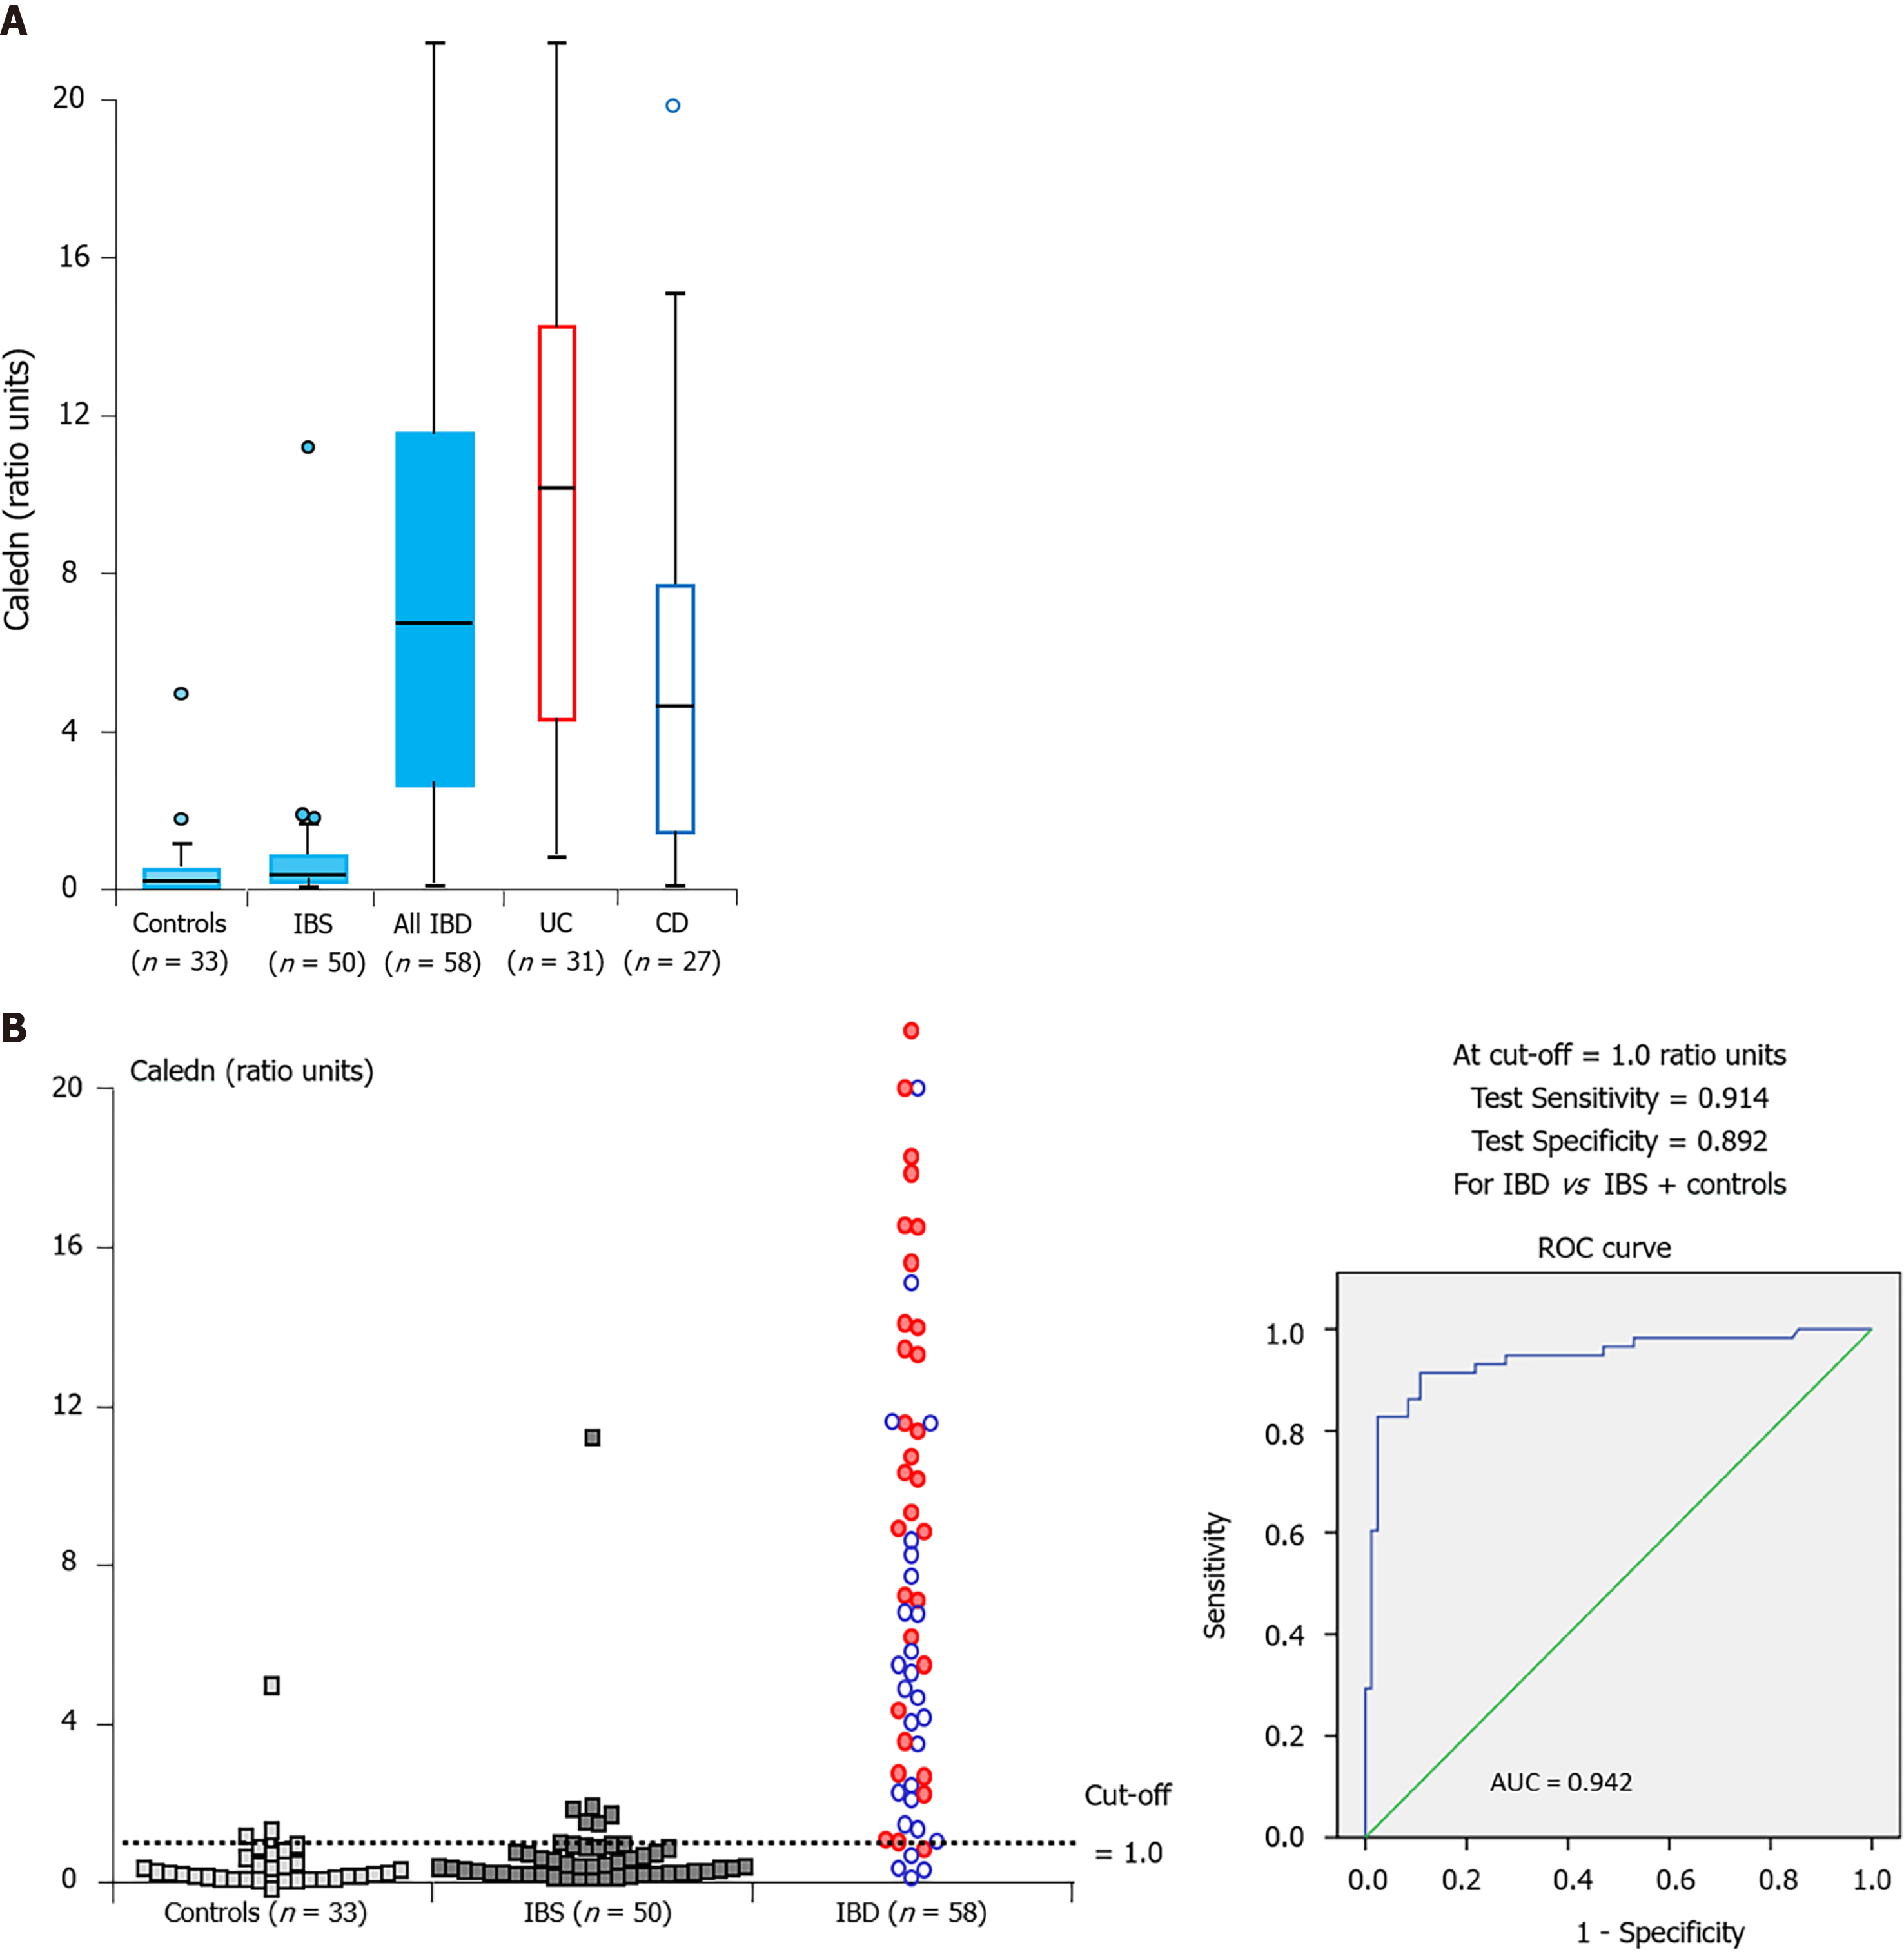
Figure 1 Box and whisker plot and individual result distributions and receiver operating characteristic curve for the combined CALEDN test at stage 1 of the study.
In the panel within the inflammatory bowel disease group, blue and red circles correspond to Crohn’s disease and ulcerative colitis cases, respectively. AUC: Area under the curve; IBS: Irritable bowel syndrome; CD: Crohn’s disease; UC: Ulcerative colitis. Citation: Loktionov A, Chhaya V, Bandaletova T, Poullis A. Inflammatory bowel disease detection and monitoring by measuring biomarkers in non-invasively collected colorectal mucus. J Gastroenterol Hepatol 2017; 32: 992-1002. Copyright© The Authors 2017. Published by John Wiley and Sons. A: Box and whisker plot; B: Receiver operating characteristic curve.
- Citation: Nooredinvand HA, Poullis A. Emerging role of colorectal mucus in gastroenterology diagnostics. World J Gastroenterol 2022; 28(12): 1220-1225
- URL: https://www.wjgnet.com/1007-9327/full/v28/i12/1220.htm
- DOI: https://dx.doi.org/10.3748/wjg.v28.i12.1220


