Copyright
©The Author(s) 2022.
World J Gastroenterol. Mar 14, 2022; 28(10): 1024-1054
Published online Mar 14, 2022. doi: 10.3748/wjg.v28.i10.1024
Published online Mar 14, 2022. doi: 10.3748/wjg.v28.i10.1024
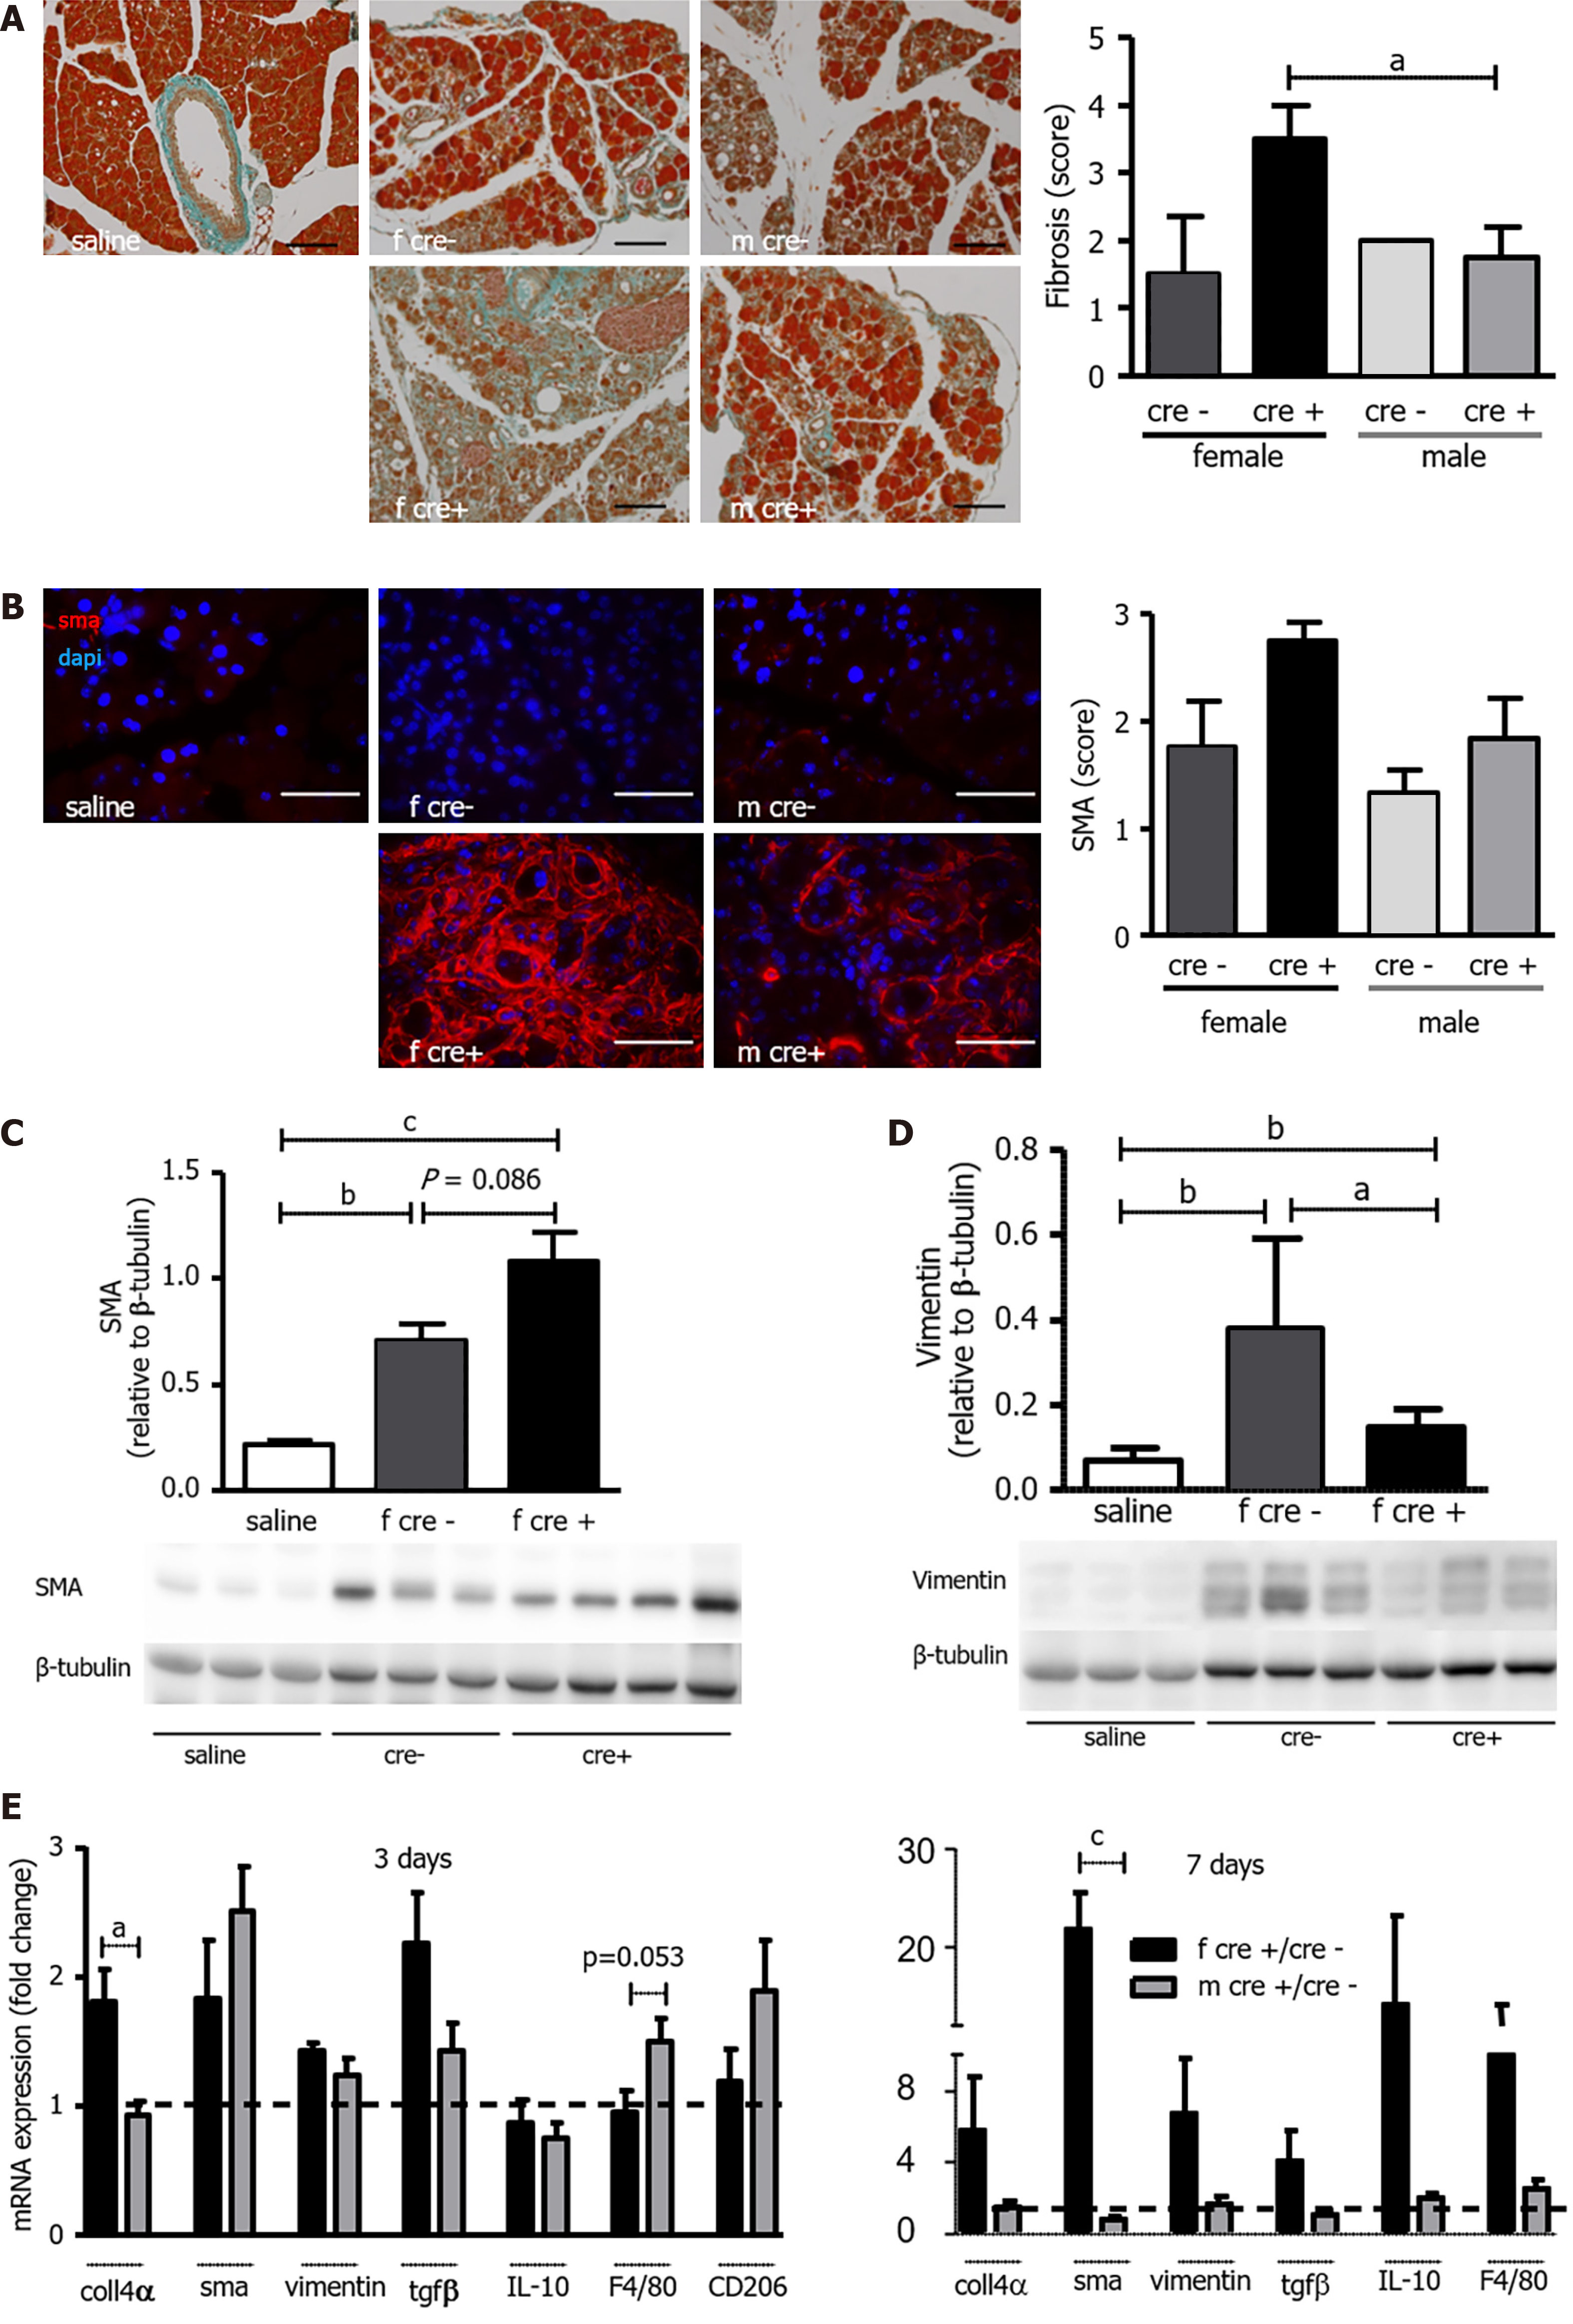
Figure 8 Female LAT1-ko mice presented with higher levels of fibrosis and expression of markers thereof.
A: Female LAT1-ko mice presented with larger areas of fibrosis. Masson’s trichrome staining (left) and quantification (right) of fibrosis in the pancreas three days after the onset of acute pancreatitis (AP). A score from 0 to 5 was attributed to each section in a blinded fashion, which was dependent on the extent of the fibrosis. The Bar length corresponds to 100 μm. Mean ± SEM, n = 4-6. Statistical analysis was conducted with ANOVA and Bonferroni and then compared, as indicated by the capped line. aP < 0.05; B-D: Female LAT1-ko mice exhibited enhanced activation of pancreatic stellate cells (PSC) compared to their littermates; B: Immunohistochemistry (left) and quantification (right) for smooth muscle actin (SMA) in the pancreas three days after the onset of AP. A score from 0 to 3 was attributed to each section in a blinded fashion depending on the signal intensity of the SMA staining. The paraffin-embedded mouse pancreas was stained for SMA (red) and the nuclei were stained in blue (dapi). The bar length corresponds to 50 μm. Mean ± SEM, n = 5; C: SMA that was indicative of activated PSC was also analyzed with Western blotting (12% SDS-PAGE gel, cells’ total lysates from female mice) three days after the onset of AP; this process led to a band being exhibited at approximately 42 kDa. The results were expressed relative to β-tubulin. Mean ± SEM, n = 3-6. Statistical analysis was conducted by ANOVA and Bonferroni and then compared, as indicated by the capped line. bP < 0.01, cP < 0.001; D: The marker for non-activated stellate cells of vimentin was less expressed in the female LAT1-ko mice. Vimentin was also analyzed by Western blotting (10% SDS-PAGE gel, cells’ total lysates from female mice) three days after the onset of AP and showed a band at approximately 57 kDa. The results were expressed relative to β-tubulin. Mean ± SEM, n = 3. Statistical analysis was conducted with ANOVA and Bonferroni and then compared, as indicated by the capped line. aP < 0.05; E: Female LAT1-ko mice showed an elevated expression of markers for fibrosis and similar markers for macrophages when compared to male mice on day three. The mRNA levels of collagen 4α (coll4α), SMA, vimentin, transforming growth factor β, interleukin 10, F4/80, and CD206 were analyzed via qPCR and expressed as a fold change in comparison with LAT1-wt mice three and seven days after the onset of AP. The line indicates the expression level of LAT1-wt animals. Mean ± SEM, n = 5. Statistical analysis was conducted via an unpaired, two-tailed t-test, and a comparison was then made, as indicated by the capped line. aP < 0.05, cP < 0.001.
- Citation: Hagen CM, Roth E, Graf TR, Verrey F, Graf R, Gupta A, Pellegrini G, Poncet N, Camargo SMR. Loss of LAT1 sex-dependently delays recovery after caerulein-induced acute pancreatitis. World J Gastroenterol 2022; 28(10): 1024-1054
- URL: https://www.wjgnet.com/1007-9327/full/v28/i10/1024.htm
- DOI: https://dx.doi.org/10.3748/wjg.v28.i10.1024


