Copyright
©The Author(s) 2022.
World J Gastroenterol. Mar 14, 2022; 28(10): 1024-1054
Published online Mar 14, 2022. doi: 10.3748/wjg.v28.i10.1024
Published online Mar 14, 2022. doi: 10.3748/wjg.v28.i10.1024
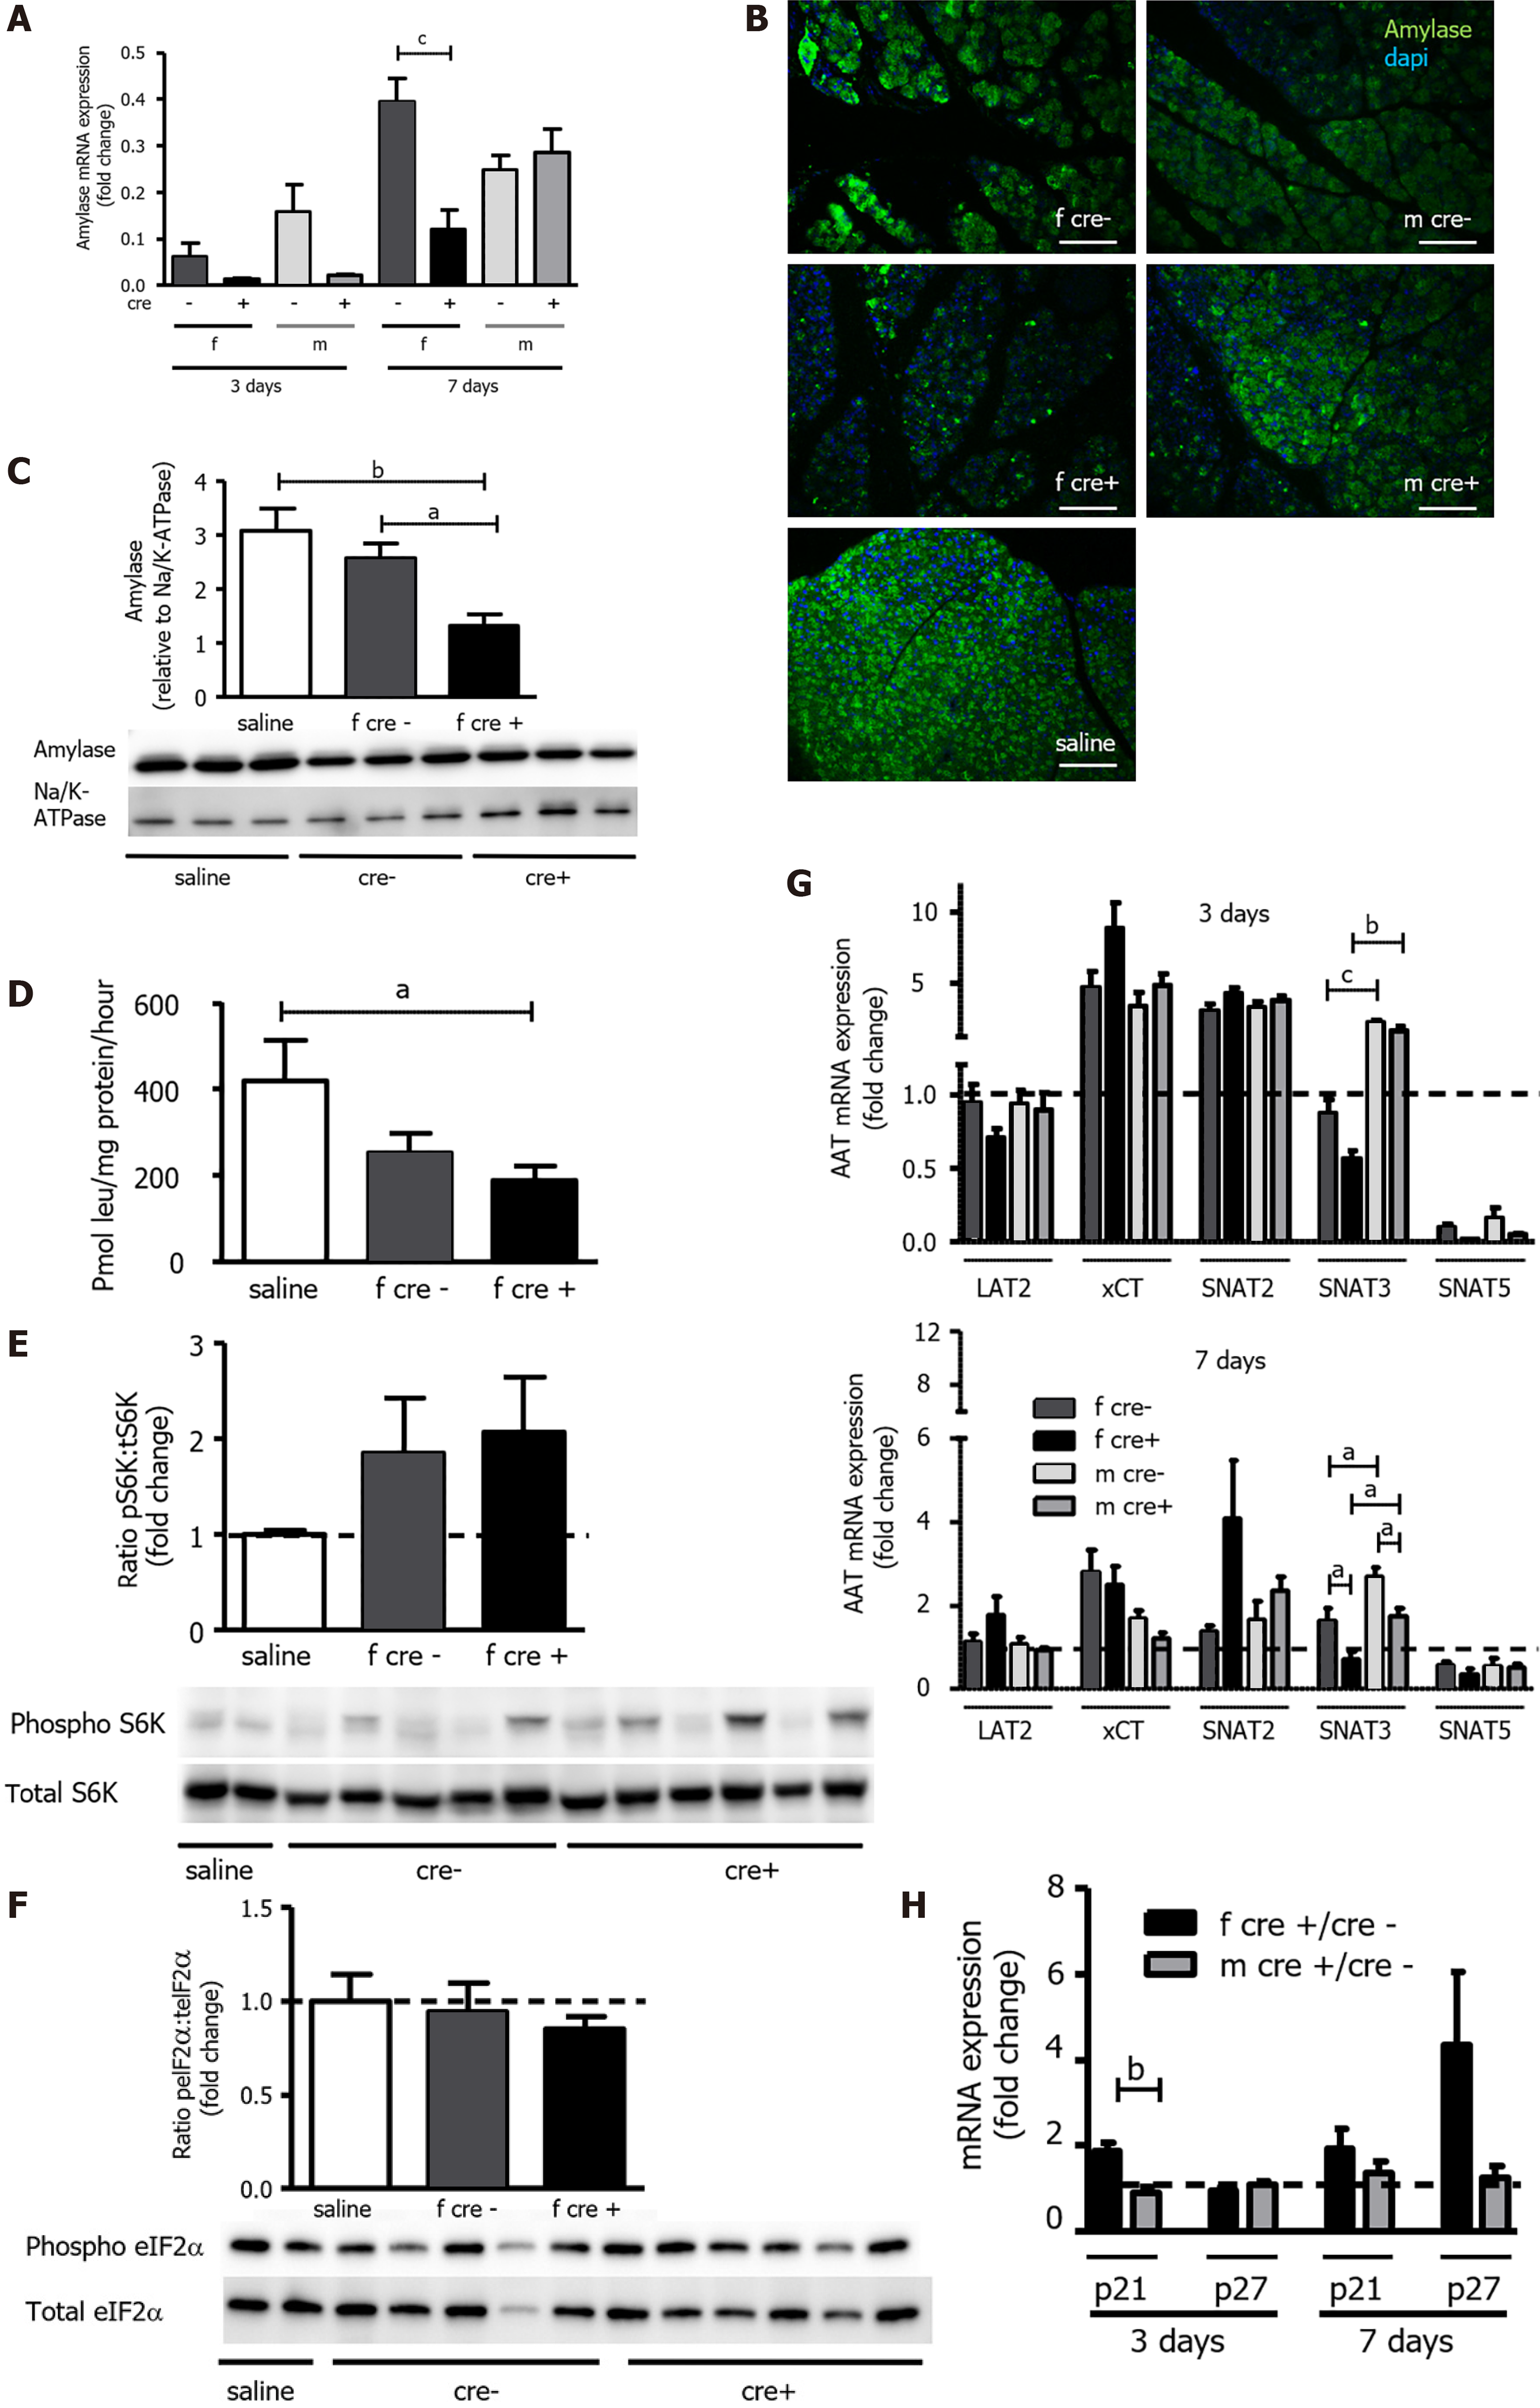
Figure 7 Functional recovery of acinar cells was delayed in LAT1-ko mice after injury.
A-C: Amylase mRNA and protein levels were reduced in female LAT1-ko mice. A: The mRNA of amylase was examined via qPCR and expressed as a fold change; subsequently, this value was compared to those relating to the saline-injected controls three and seven days after the onset of acute pancreatitis (AP). Mean ± SEM, n = 45. Subsequently, statistical analysis was conducted with ANOVA and Bonferroni and then compared, as indicated by the capped line. cP < 0.001; B: Decreased amylase expression could also be evidenced by reduced signal intensity in immunofluorescence three days after AP induction. The paraffin-embedded mouse pancreas was stained for amylase (green), and the nuclei were stained in blue (dapi). The bar length corresponds to 100 μm; C: Amylase protein was analyzed with Western blotting (10% SDS-PAGE gel, cells’ total lysates) three days after the onset of AP; it exhibited a band at approximately 60 kDa. The results were expressed relative to Na/K-ATPase; D: LAT1-ko mice showed lower protein synthesis compared to the saline-injected controls, as measured by the incorporation of 3H-leucine into total protein and expressed as pmol leu/mg protein/hour three days after the onset of AP in female mice. Mean ± SEM, n = 3-8. Statistical analysis was conducted with ANOVA and Bonferroni and then compared, as indicated by the capped line. aP < 0.05; E-F: Mammalian target of rapamycin was increased, and the general control nonderepressible 2 (GCN2) pathway was not activated in LAT1-ko mice three days after AP; E: Phosphorylated and total S6K levels were determined with Western blotting (8% SDS-PAGE gel, cells’ total lysates) three days after the onset of AP; there was a band at approximately 70 kDa. The results were expressed as a ratio of phosphorylated to total protein relative to the saline-injected controls; F: GCN2’s downstream target eukaryotic-translation-initiation factor 2α was analyzed using Western blotting (12% SDS-PAGE gel, cells’ total lysates) three days after the onset of AP, and a band appeared at approximately 38 kDa. The results were expressed as a ratio of phosphorylated to total protein relative to the saline-injected controls. Mean ± SEM, n = 5-6; G: The expression of SNAT3 was lower in female mice until seven days after the onset of AP. The mRNA expression of LAT2 (slc7a8), xCT (slc7a11), SNAT2 (slc38a2), SNAT3 (slc38a3), and SNAT5 (slc38a5) was analyzed via qPCR and expressed as a fold change in comparison with saline-injected controls three and seven days after the onset of AP. The line indicates the expression level of the control animals. Mean ± SEM, n = 5-10. Statistical analysis was conducted with ANOVA and Bonferroni and then compared, as indicated by the capped line. aP < 0.05, bP < 0.01, cP < 0.001; H: Expression of senescence markers was more accentuated in female LAT1-ko mice up until seven days after the onset of AP. The mRNA levels of p21 and p27 were analyzed via qPCR and expressed as a fold change, which was compared to the LAT1-wt group three and seven days after the onset of AP. The line indicates the expression level of the LAT1-wt animals. Mean ± SEM, n = 5. Statistical analysis was conducted via an unpaired, two-tailed t-test. As indicated by the capped line, a comparison was then made. bP < 0.01.
- Citation: Hagen CM, Roth E, Graf TR, Verrey F, Graf R, Gupta A, Pellegrini G, Poncet N, Camargo SMR. Loss of LAT1 sex-dependently delays recovery after caerulein-induced acute pancreatitis. World J Gastroenterol 2022; 28(10): 1024-1054
- URL: https://www.wjgnet.com/1007-9327/full/v28/i10/1024.htm
- DOI: https://dx.doi.org/10.3748/wjg.v28.i10.1024


