Copyright
©The Author(s) 2022.
World J Gastroenterol. Mar 14, 2022; 28(10): 1024-1054
Published online Mar 14, 2022. doi: 10.3748/wjg.v28.i10.1024
Published online Mar 14, 2022. doi: 10.3748/wjg.v28.i10.1024
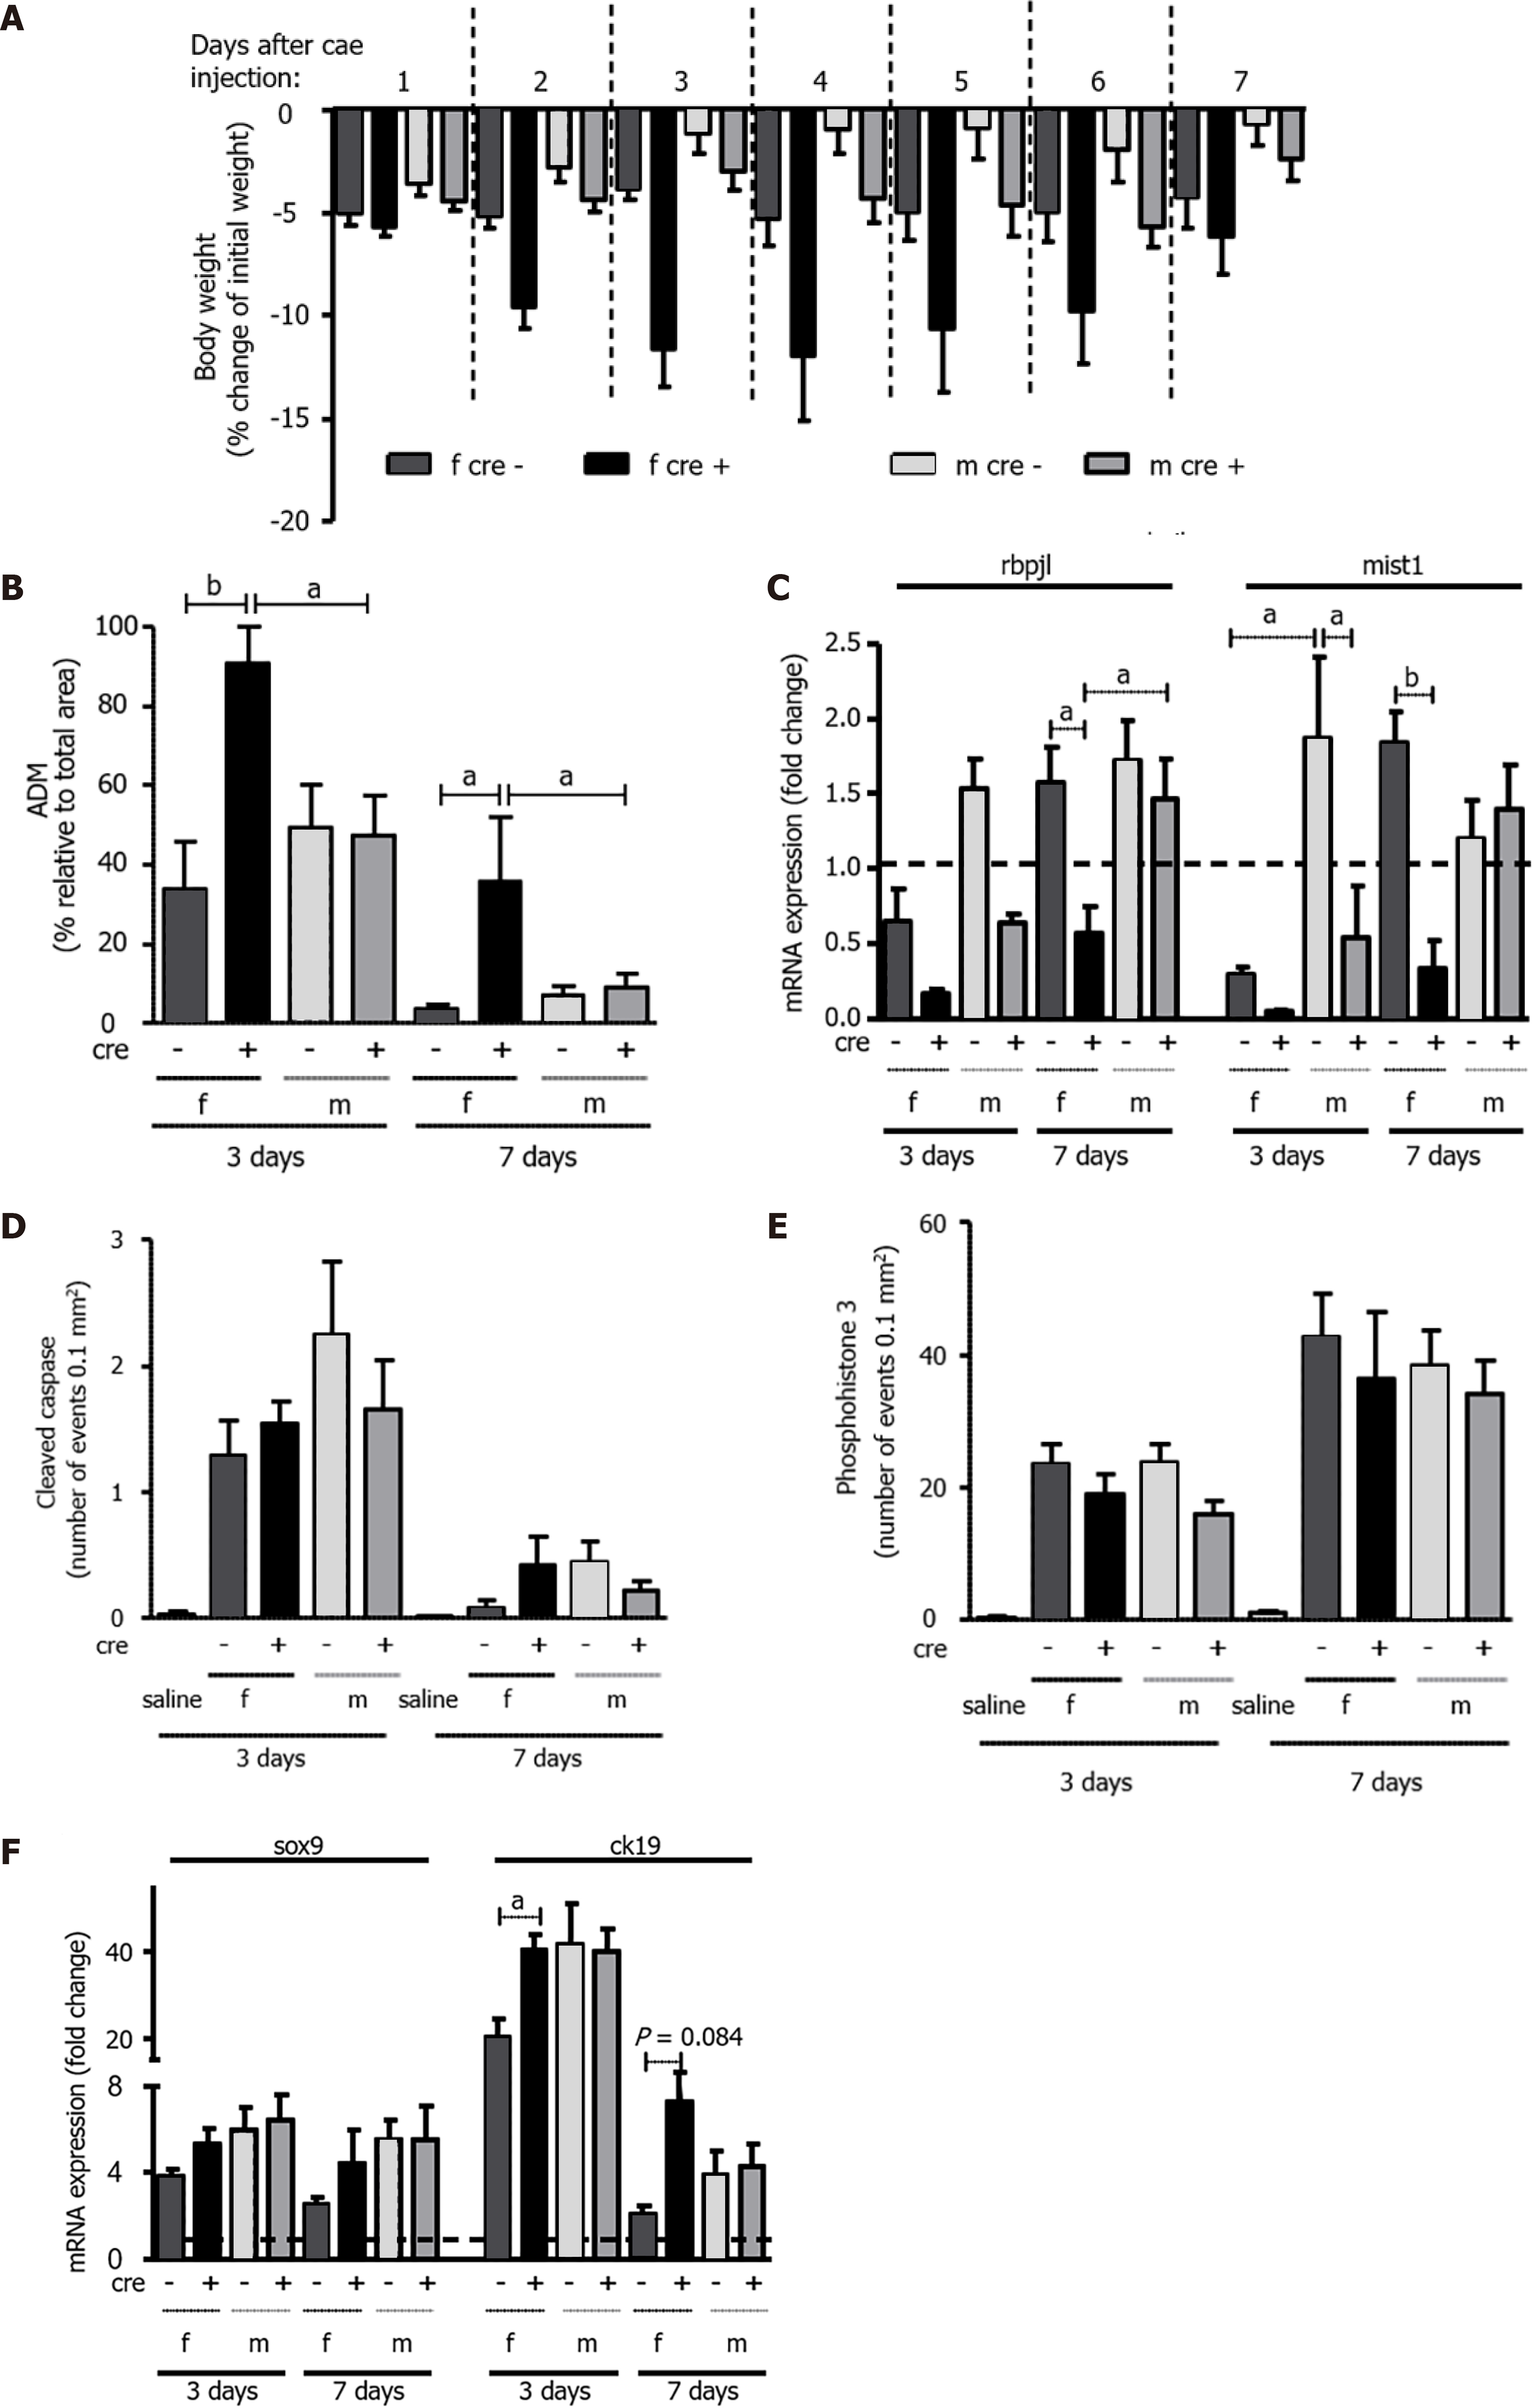
Figure 6 LAT1-ko mice showed a delayed recovery from acute pancreatitis, and the effect was more accentuated in females.
A: Weight loss in female LAT1-ko mice was more accentuated and prolonged compared to their LAT1-wt littermates. Their body weight was measured daily over a period of seven days after the caerulein injection, and it was then expressed as weight loss relative to their initial body weight. Mean ± SEM, n = 5-17; B: Acinar-to-ductal metaplasia (ADM) areas in female LAT1-ko mice were larger than in their littermates three and seven days after the onset of acute pancreatitis (AP). ADM structures were identified microscopically in the HE stains and expressed as a percentage that was relative to the total area of the pancreas. Mean ± SEM, n = 5-9; C: Markers of pancreas-specific differentiation were lower in female LAT1-ko mice up to seven days after the onset of AP. Meanwhile, the mRNA expression of recombining the binding protein suppressor of hairless-like protein (rbpjl) and basic helix-loop-helix family member A15 (mist1) was analyzed via qPCR, expressed as a fold change, and then compared to saline-injected controls three and seven days after the onset of AP. The line indicates the expression level found in the control animals. Mean ± SEM, n = 3-5; D-E: Apoptosis and proliferation did not differ between the groups with AP, as demonstrated by immunohistochemistry analyses of D: cleaved caspase and E: phosphohistone 3, respectively. The results were expressed according to the number of events in acinar cells per 0.1 mm2. Mean ± SEM, n = 5-9; F: The expression level of genes that are characteristic of dedifferentiation was elevated in female LAT1-ko mice up to day seven. Meanwhile, the mRNA expression of SRY-box transcription factor 9 (sox9) and cytokeratin 19 (ck19) was determined via qPCR and expressed as a fold change, which was compared to saline-injected controls three and seven days after the onset of AP. The line indicates the expression level of the control animals. Mean ± SEM, n = 3-5. Statistical analysis was conducted with ANOVA and Bonferroni and then compared, as indicated by the capped line. aP < 0.05, bP < 0.01, cP < 0.001.
- Citation: Hagen CM, Roth E, Graf TR, Verrey F, Graf R, Gupta A, Pellegrini G, Poncet N, Camargo SMR. Loss of LAT1 sex-dependently delays recovery after caerulein-induced acute pancreatitis. World J Gastroenterol 2022; 28(10): 1024-1054
- URL: https://www.wjgnet.com/1007-9327/full/v28/i10/1024.htm
- DOI: https://dx.doi.org/10.3748/wjg.v28.i10.1024


