Copyright
©The Author(s) 2022.
World J Gastroenterol. Mar 14, 2022; 28(10): 1024-1054
Published online Mar 14, 2022. doi: 10.3748/wjg.v28.i10.1024
Published online Mar 14, 2022. doi: 10.3748/wjg.v28.i10.1024
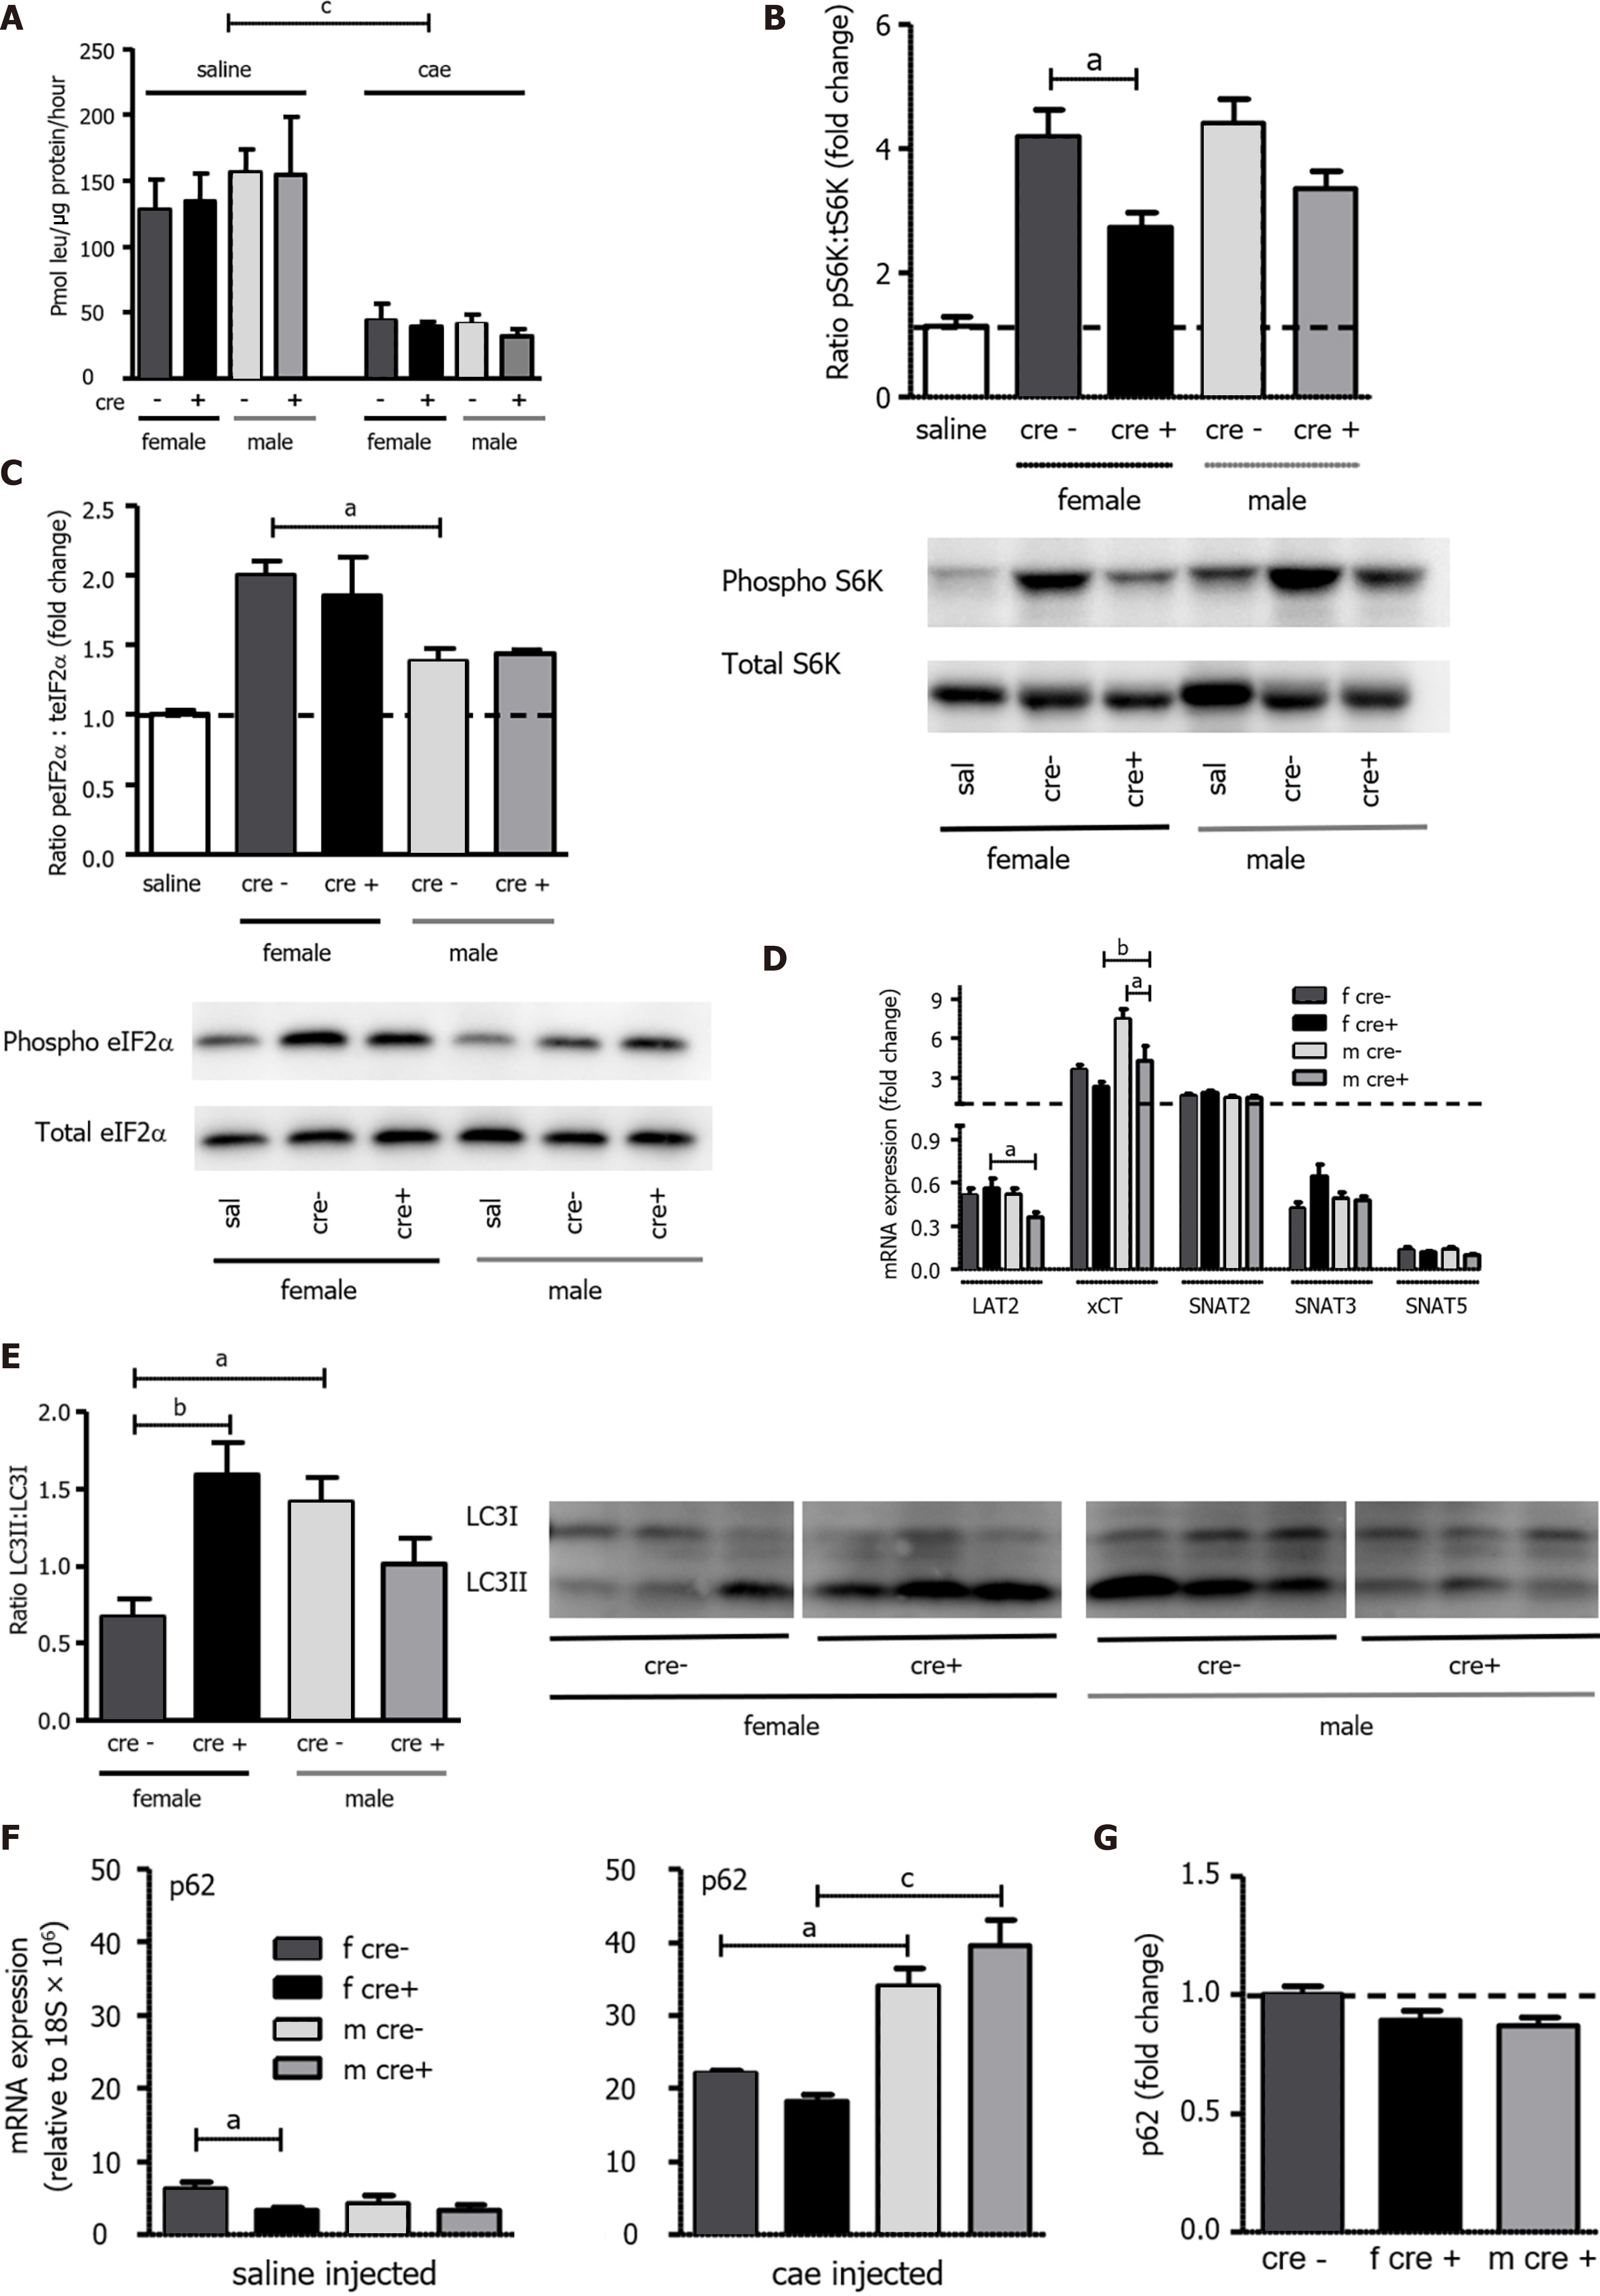
Figure 5 Protein synthesis, mammalian target of rapamycin, and general control nonderepressible 2 pathways as well as autophagy were differently regulated upon knockout of LAT1.
A: As measured by the incorporation of 3H-leucine into total protein and expressed as pmol leu/mg protein/hour, protein synthesis was seen to decrease in both genotypes 24 h after the onset of acute pancreatitis (AP). Mean ± SEM, n = 3-8; B: The mammalian target of rapamycin (mTOR) downstream target S6 kinase (S6K) was activated to a lesser degree in female LAT1-ko mice. Phosphorylated and total S6K levels were determined with Western blotting (8% SDS-PAGE gel, cells’ total lysates) 24 h after the onset of AP, and they showed a band at approximately 70 kDa. The results were expressed as a ratio of phosphorylated to total protein relative to the saline-injected controls; C: General control nonderepressible (GCN2) was more activated in females. The GCN2 downstream target eukaryotic-translation-initiating factor 2α (eIF2α) was analyzed via Western blotting (12% SDS-PAGE gel, cells’ total lysates) 24 h after the onset of AP, and it exhibited a band at approximately 38 kDa. The results were expressed as ratio of phosphorylated to total protein, which was relative to the saline-injected controls. Mean ± SEM, n = 4; D: Variation of amino acid transporter expression after AP induction. The mRNA expression of LAT2 (slc7a8), xCT (slc7a11), SNAT2 (slc38a2), SNAT3 (slc38a3), and SNAT5 (slc38a5) was analyzed via qPCR and expressed as a fold change that was compared to saline-injected controls 24 h after the onset of AP. The line indicates the expression level of the control animals. Mean ± SEM, n = 5-8; E-G: Female LAT1-ko mice presented with enhanced markers for dysfunctional autophagy. E: The ratio of microtubule-associated protein 1A/1B-light chain 3 II (LC3II) to LC3I was higher in female LAT1-ko compared to female LAT1-wt. Moreover, the LC3II-to-LC3I ratio was examined using Western blotting (13.5% SDS-PAGE gel, cells’ total lysates) 24 h after the onset of AP; a double band appeared at approximately 15 kDa. The upper band represents LC3I, and the lower band indicates LC3II. Mean ± SEM, n = 3-6; F-G: Male mice express more p62 mRNA, yet no more protein, than their female counterparts; F: The mRNA expression of p62 was analyzed via qPCR and expressed relative to a housekeeping gene (18S × 106) in LAT1-wt and LAT1-ko mice. The upper panel depicts the mice that were injected with saline, and the lower panel highlights the mice 24 h after AP induction. Mean ± SEM, n = 3-7; G: The p62 protein was analyzed with Western blotting (12% SDS-PAGE gel, cells’ total lysates) 24 h after the onset of AP, and it exhibited a band at approximately 62 kDa. The results were expressed relative to β-tubulin and normalized in line with the LAT1-wt average indicated by the line. Mean ± SEM, n = 5-8. The statistical analysis was conducted by ANOVA and Bonferroni and then compared, as indicated by the capped line. aP < 0.05, bP < 0.01, cP < 0.001.
- Citation: Hagen CM, Roth E, Graf TR, Verrey F, Graf R, Gupta A, Pellegrini G, Poncet N, Camargo SMR. Loss of LAT1 sex-dependently delays recovery after caerulein-induced acute pancreatitis. World J Gastroenterol 2022; 28(10): 1024-1054
- URL: https://www.wjgnet.com/1007-9327/full/v28/i10/1024.htm
- DOI: https://dx.doi.org/10.3748/wjg.v28.i10.1024


