Copyright
©The Author(s) 2022.
World J Gastroenterol. Mar 14, 2022; 28(10): 1024-1054
Published online Mar 14, 2022. doi: 10.3748/wjg.v28.i10.1024
Published online Mar 14, 2022. doi: 10.3748/wjg.v28.i10.1024
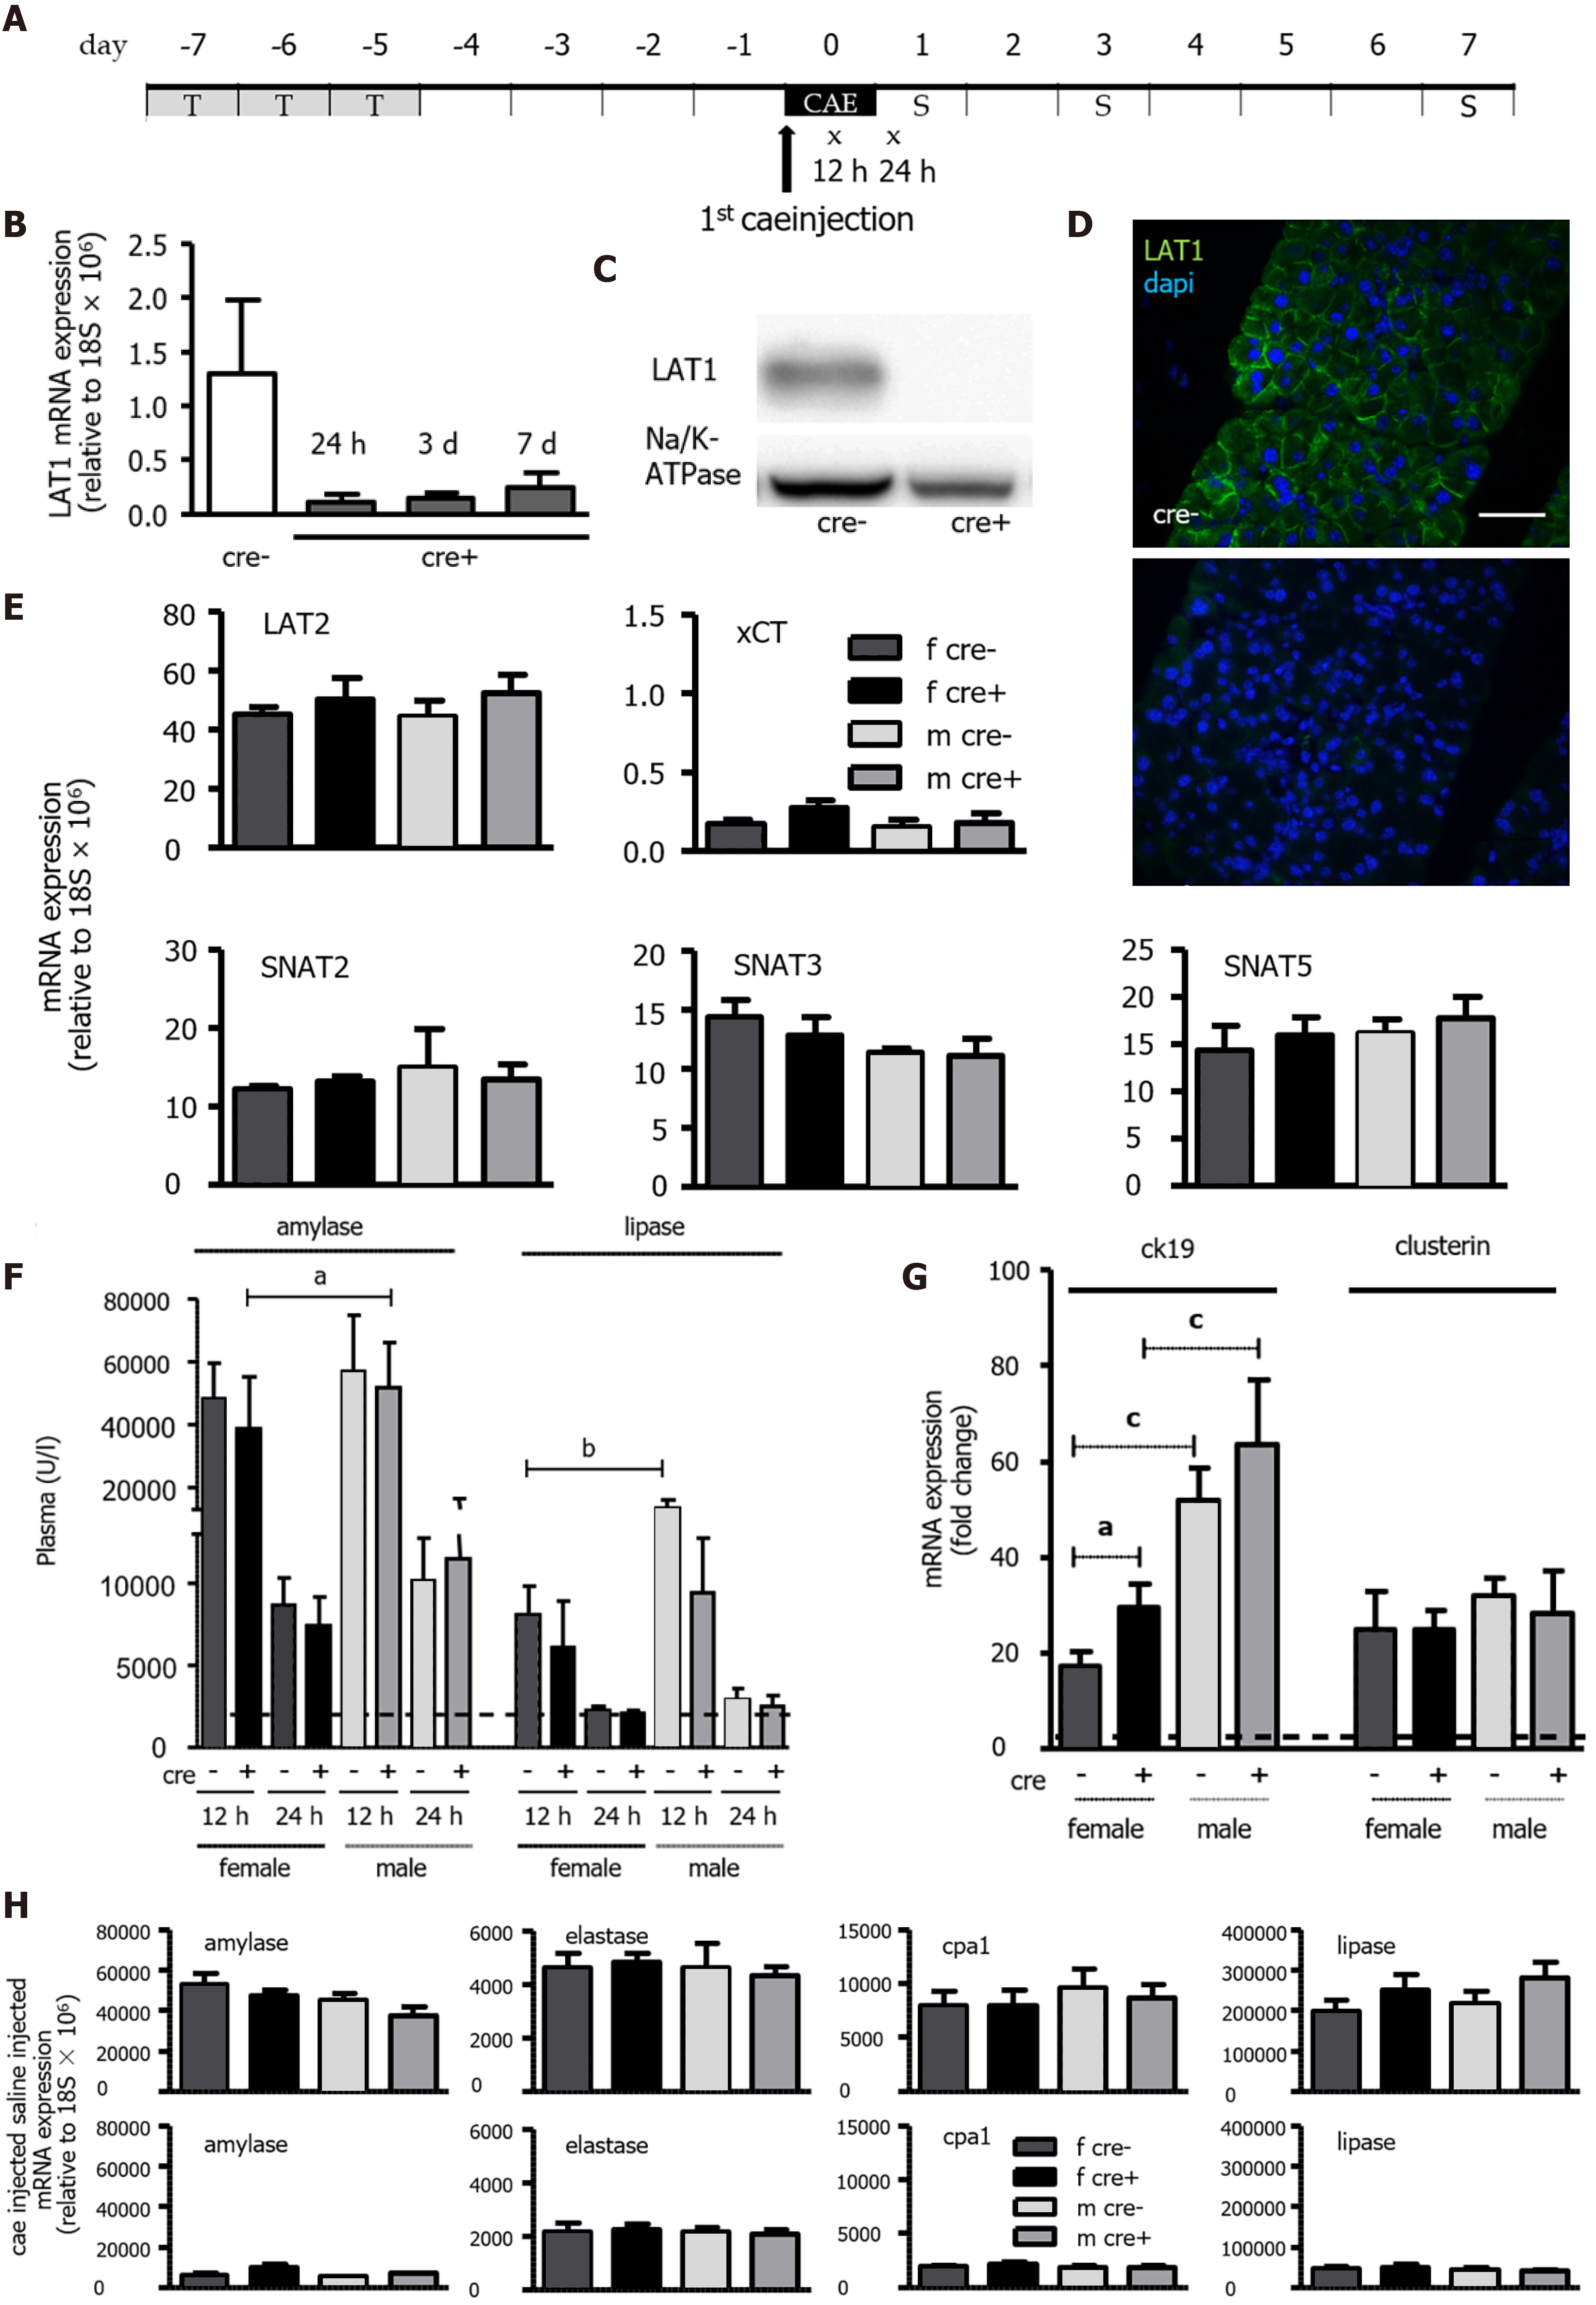
Figure 2 Tamoxifen-induced knockout of LAT1 was efficient in the pancreas, and the mice developed acute pancreatitis in an equivocal manner.
A: Experimental timeline. Three consecutive days of Tamoxifen gavage began seven days prior to acute pancreatitis (AP) induction by caerulein (cae). The first injection of cae marks day zero. Blood for amylase and lipase analysis was drawn 12 and 24 h afterwards (indicated with x). The mice were sacrificed on days one, three, and seven following the first cae injection (indicated with S); B-D: The knockout of LAT1 (slc7a5) at the mRNA and protein level was efficient during the period the experiments were conducted. B: mRNA expression for LAT1 was analyzed via qPCR and relative to a housekeeping gene (18S × 106) in LAT1-ko mice one, three and seven days after the onset of AP, and it was compared to the LAT1-wt mice. C: The LAT1 protein was analyzed with Western blotting (10% SDS-PAGE gel, membrane fraction of cell lysates) three days after the onset of AP, and it displayed a band at approximately 39 kDa. The results were expressed in a manner relative to Na/K-ATPase, and they were normalized in line with untreated animals; D: The paraffin-embedded mouse pancreas was stained for LAT1 (green), and the nuclei were stained in blue (dapi). The top panel depicts LAT1 in LAT1-wt mice, and the bottom is in relation to LAT1-ko mice. The bar length corresponds to 50 μm. E: Neither the knocking out of LAT1 nor the administration of tamoxifen treatment modified the expression of other amino acid transporters (AAT). The mRNA expression of LAT2 (slc7a8), xCT (slc7a11), SNAT2 (slc38a2), SNAT3 (slc38a3), and SNAT5 (slc38a5) was analyzed via qPCR relative to a housekeeping gene (18S × 106) in LAT1-wt and LAT1-ko mice treated with tamoxifen and saline. Mean ± SEM, n = 3-8; F: Plasma amylase and lipase increased in LAT1-wt and LAT1-ko mice after the onset of AP. The line indicates the plasma value when it is at a healthy level. Mean ± SEM, n = 7-25; G: LAT1-ko mice exhibited an enhanced presence of dedifferentiation markers. The mRNA expression of cytokeratin 19 (ck19) and clusterin was analyzed via qPCR and expressed as a fold change relative to saline-injected controls 24 h after the onset of AP. The line indicates the expression level of the control animals. Mean ± SEM, n = 5-7. H: mRNA expression of amylase, elastase, carboxypeptidase 1 (cpa1), and lipase was analyzed via qPCR relative to a housekeeping gene (18S × 106), and it was not modified by LAT1 knockout or tamoxifen treatment, yet it decreased after the onset of AP. The upper panel depicts the mice injected with saline, and the lower panel highlights the mice 24 h after AP induction. Mean ± SEM, n = 3-8. The statistical analysis was conducted by ANOVA and Bonferroni, and then it was compared, as indicated by the capped line. aP < 0.05, bP < 0.01, cP < 0.001.
- Citation: Hagen CM, Roth E, Graf TR, Verrey F, Graf R, Gupta A, Pellegrini G, Poncet N, Camargo SMR. Loss of LAT1 sex-dependently delays recovery after caerulein-induced acute pancreatitis. World J Gastroenterol 2022; 28(10): 1024-1054
- URL: https://www.wjgnet.com/1007-9327/full/v28/i10/1024.htm
- DOI: https://dx.doi.org/10.3748/wjg.v28.i10.1024


