Copyright
©The Author(s) 2022.
World J Gastroenterol. Mar 14, 2022; 28(10): 1024-1054
Published online Mar 14, 2022. doi: 10.3748/wjg.v28.i10.1024
Published online Mar 14, 2022. doi: 10.3748/wjg.v28.i10.1024
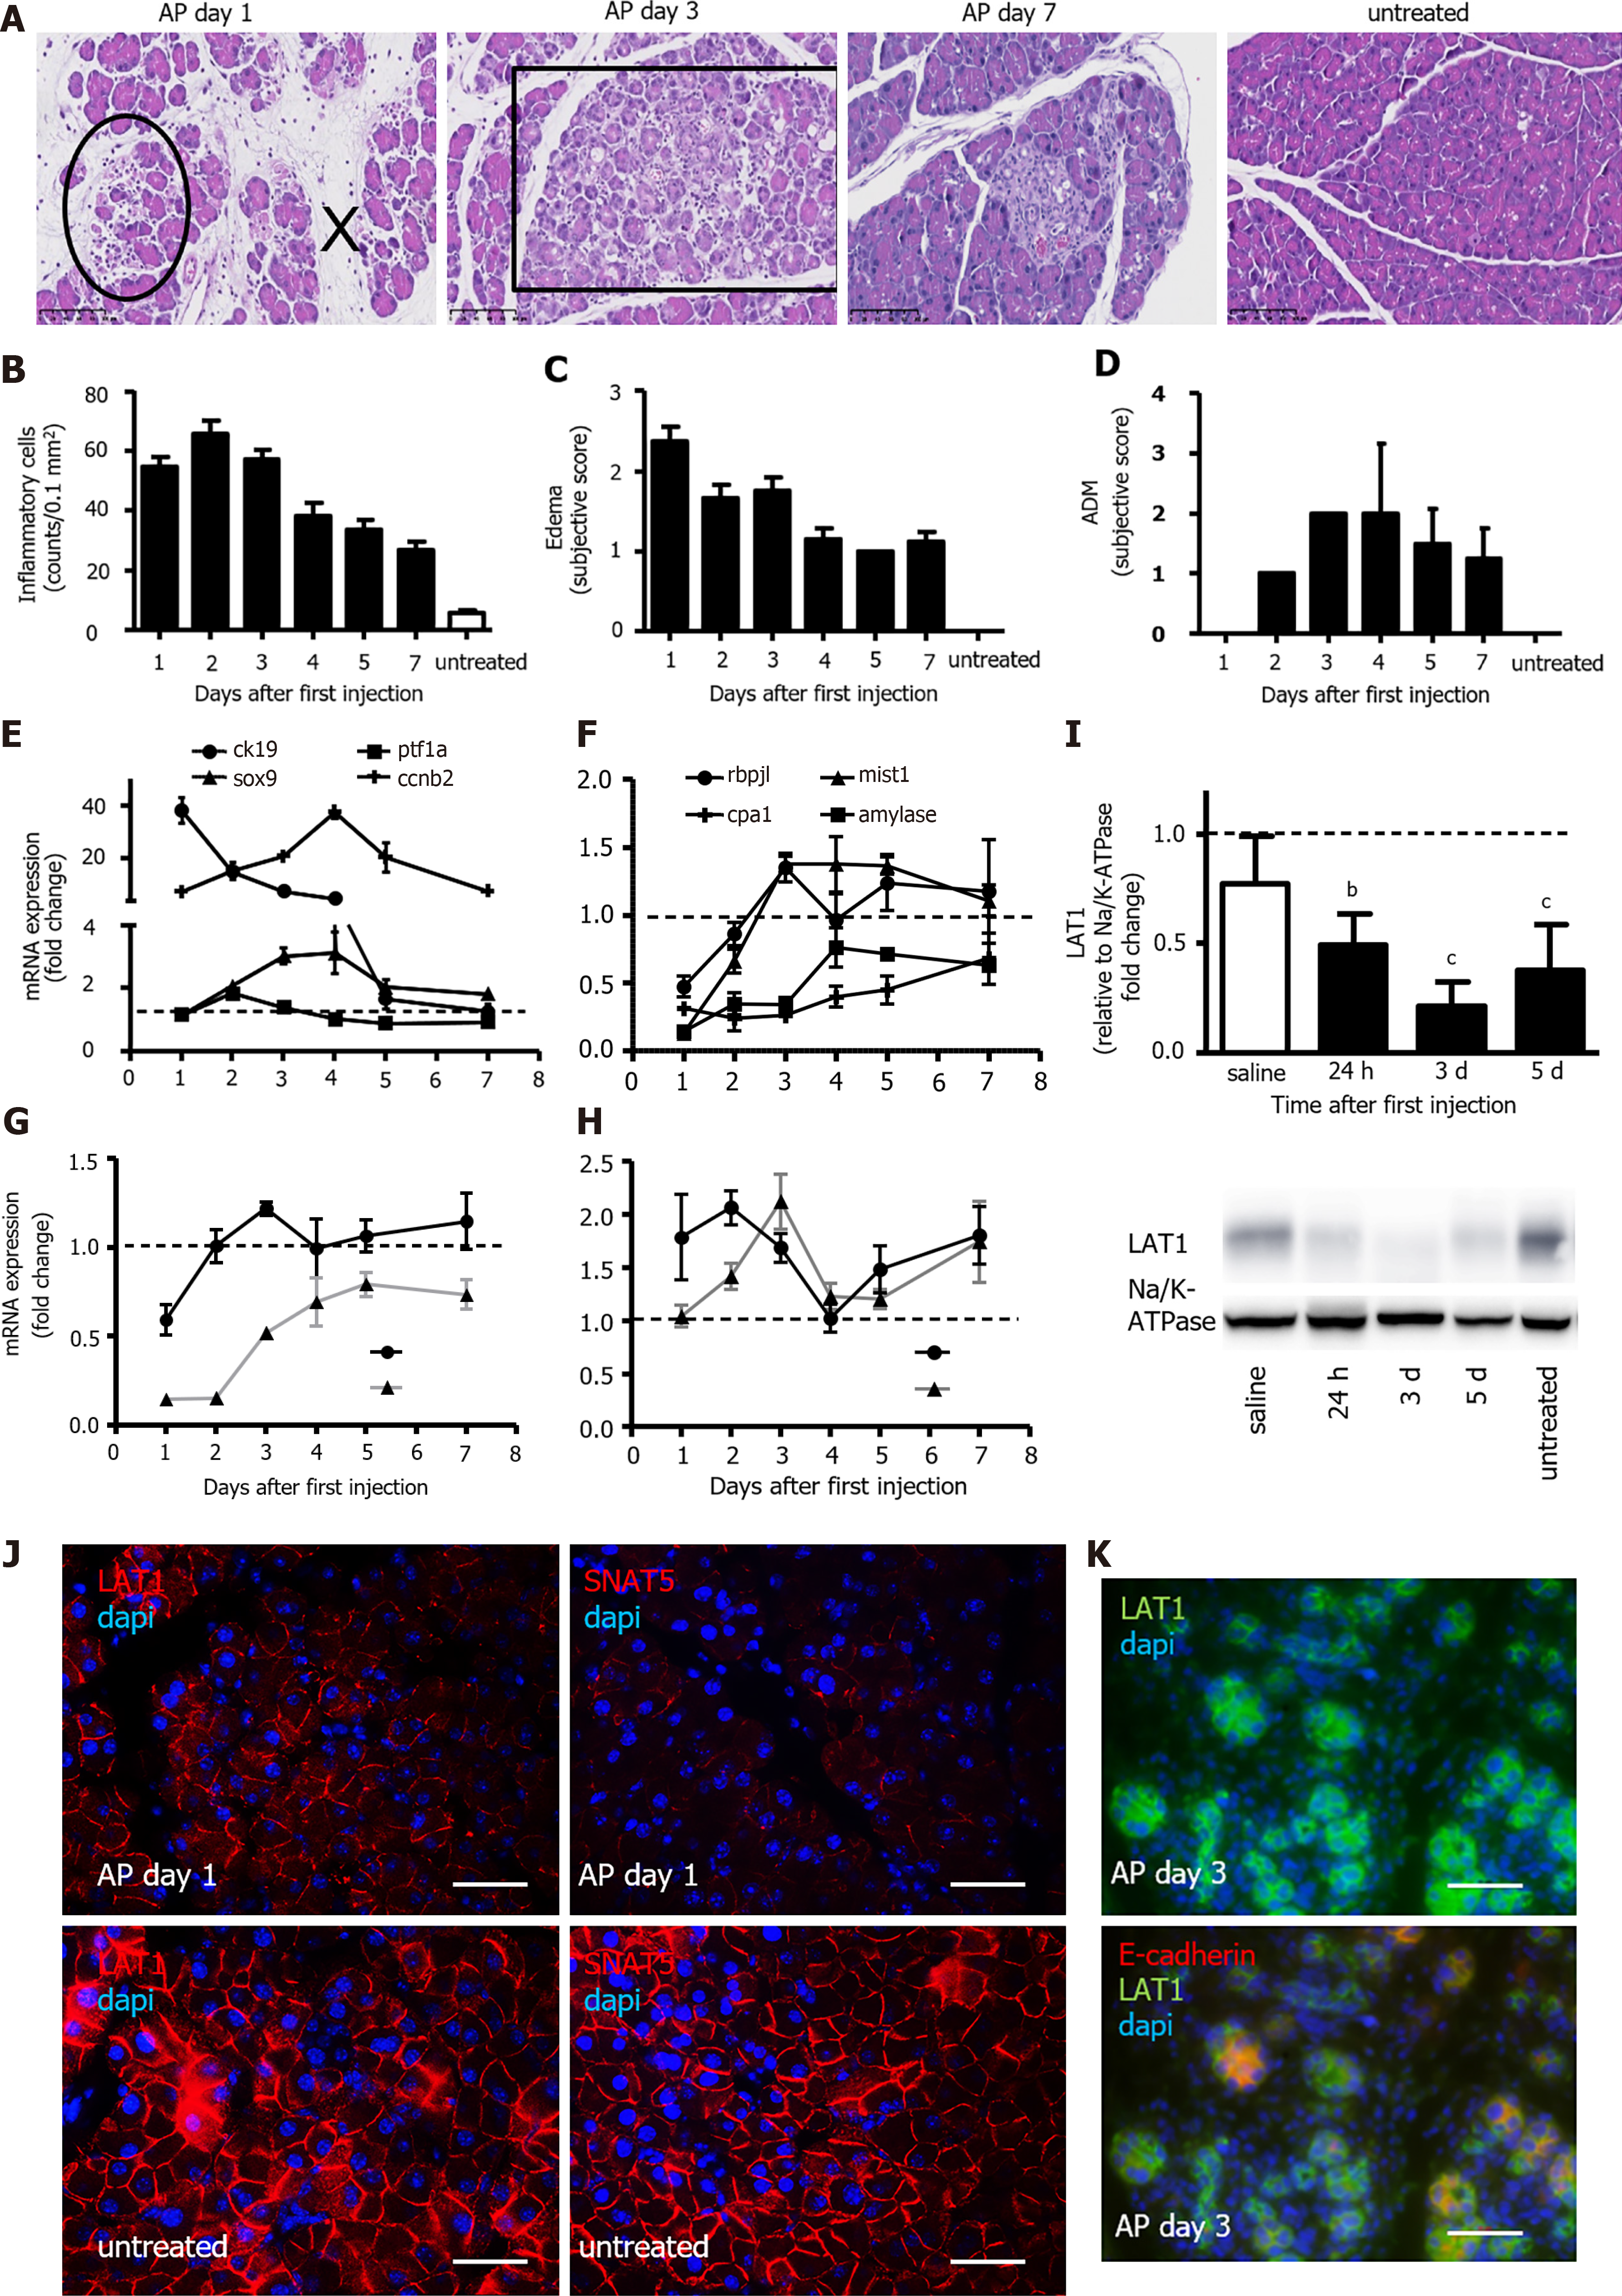
Figure 1 During recovery from acute pancreatitis, the expression of the amino acid transporter LAT1 was changed in a different way alongside dedifferentiation and the appearance of maturity markers for acinar cells.
A-D: Morphological analysis of the pancreas after the induction of acute pancreatitis (AP). A: HE stain depicting changes during the observed time period. Circle: inflammatory cells, x: edema, square: acinar-to-ductal metaplasia (ADM); B: Quantification of inflammatory cells as counts per 0.1 mm2 field; C: Edema; D: ADM score from 0 to 3; E-F: Variation of dedifferentiation and maturity markers over seven days; mRNA expression for genes of E: dedifferentiation (ck19, SRY-box transcription factor 9 (sox9), pancreas associated transcription factor 1a (ptf1a)) and proliferation (cyclin b2 (ccnb2)) as well as F: organ-specific maturity (recombining binding protein suppressor of hairless-like protein (rbpjl), basic helix-loop-helix family member A15 (mist1), amylase, and carboxypeptidase 1 (cpa1)) in pancreas was analyzed via qPCR and expressed as a fold change that was compared to untreated controls, n = 4. The line indicates the expression level found in the control animals; G-H: Variations of amino acid transporter (AAT) gene expression alongside injury and regeneration. mRNA expression of G: SNAT3 (slc38a3) and SNAT5 (slc38a5) and H: LAT1 (slc7a5) and LAT2 (slc7a8) was examined via qPCR and expressed as a fold change that was compared to untreated controls (n = 4). The line indicates the expression level found in the control animals; I-K: LAT1 expression decreased but did not disappear during injury and regeneration; I: LAT1 protein was analyzed with Western blotting (10% SDS-PAGE gel and membrane fraction of cell lysates), and it showed a band at approximately 39 kDa. The results were expressed relative to Na/K-ATPase and were normalized in line with untreated animals. The line represents the level in untreated animals. Mean ± SEM, n = 4. Statistical analysis was conducted with ANOVA and Bonferroni and then compared with the saline-injected negative control. aP < 0.05, bP < 0.01, cP < 0.001; J: LAT1 and SNAT5 were located at the basolateral membrane of acinar cells. The paraffin-embedded mouse pancreas was stained red for LAT1 or SNAT5, and the nuclei were stained in blue (4′,6-diamidino-2-phenylindole or DAPI). The panels on the left depict LAT1 24 h after AP induction (upper), and the untreated controls are below them. The panels on the right depict SNAT5 24 h after AP (upper) and the untreated controls are shown underneath. The bar length corresponds to 50 μm. K: LAT1 was present in dedifferentiated acinar cells, which were characterized by the absence of E-cadherin co-expression. The paraffin-embedded mouse pancreas was stained for LAT1 (green) and E-cadherin (red), and the nuclei were stained in blue (dapi). The top panel only depicts LAT1, while the bottom panel is overlayed with E-cadherin; in both instances, this is three days after AP induction. The bar length corresponds to 50 μm.
- Citation: Hagen CM, Roth E, Graf TR, Verrey F, Graf R, Gupta A, Pellegrini G, Poncet N, Camargo SMR. Loss of LAT1 sex-dependently delays recovery after caerulein-induced acute pancreatitis. World J Gastroenterol 2022; 28(10): 1024-1054
- URL: https://www.wjgnet.com/1007-9327/full/v28/i10/1024.htm
- DOI: https://dx.doi.org/10.3748/wjg.v28.i10.1024


