Copyright
©The Author(s) 2021.
World J Gastroenterol. Feb 28, 2021; 27(8): 708-724
Published online Feb 28, 2021. doi: 10.3748/wjg.v27.i8.708
Published online Feb 28, 2021. doi: 10.3748/wjg.v27.i8.708
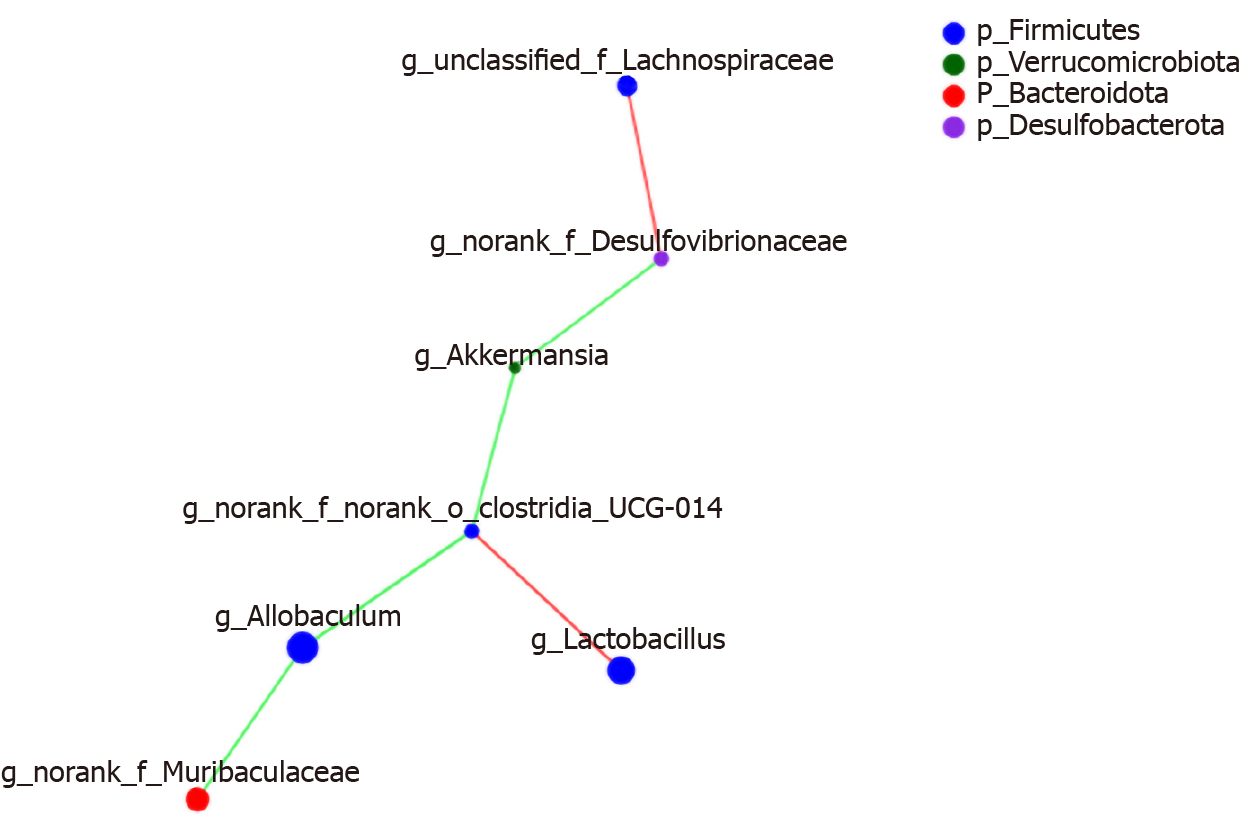
Figure 13 Construct of a species-related network at the genus level.
The colours range from green (negative correlation) to red (positive correlation). Statistical significance was based on a P value of 0.05 (Networkx). The size of the node represents the abundance of species. The thickness of the line indicates the size of the correlation coefficient. The thicker the line, the higher the correlation between species; the more lines, the closer the relationship between the species and other species.
- Citation: Zhao JD, Li Y, Sun M, Yu CJ, Li JY, Wang SH, Yang D, Guo CL, Du X, Zhang WJ, Cheng RD, Diao XC, Fang ZH. Effect of berberine on hyperglycaemia and gut microbiota composition in type 2 diabetic Goto-Kakizaki rats. World J Gastroenterol 2021; 27(8): 708-724
- URL: https://www.wjgnet.com/1007-9327/full/v27/i8/708.htm
- DOI: https://dx.doi.org/10.3748/wjg.v27.i8.708


