Copyright
©The Author(s) 2021.
World J Gastroenterol. Feb 28, 2021; 27(8): 708-724
Published online Feb 28, 2021. doi: 10.3748/wjg.v27.i8.708
Published online Feb 28, 2021. doi: 10.3748/wjg.v27.i8.708
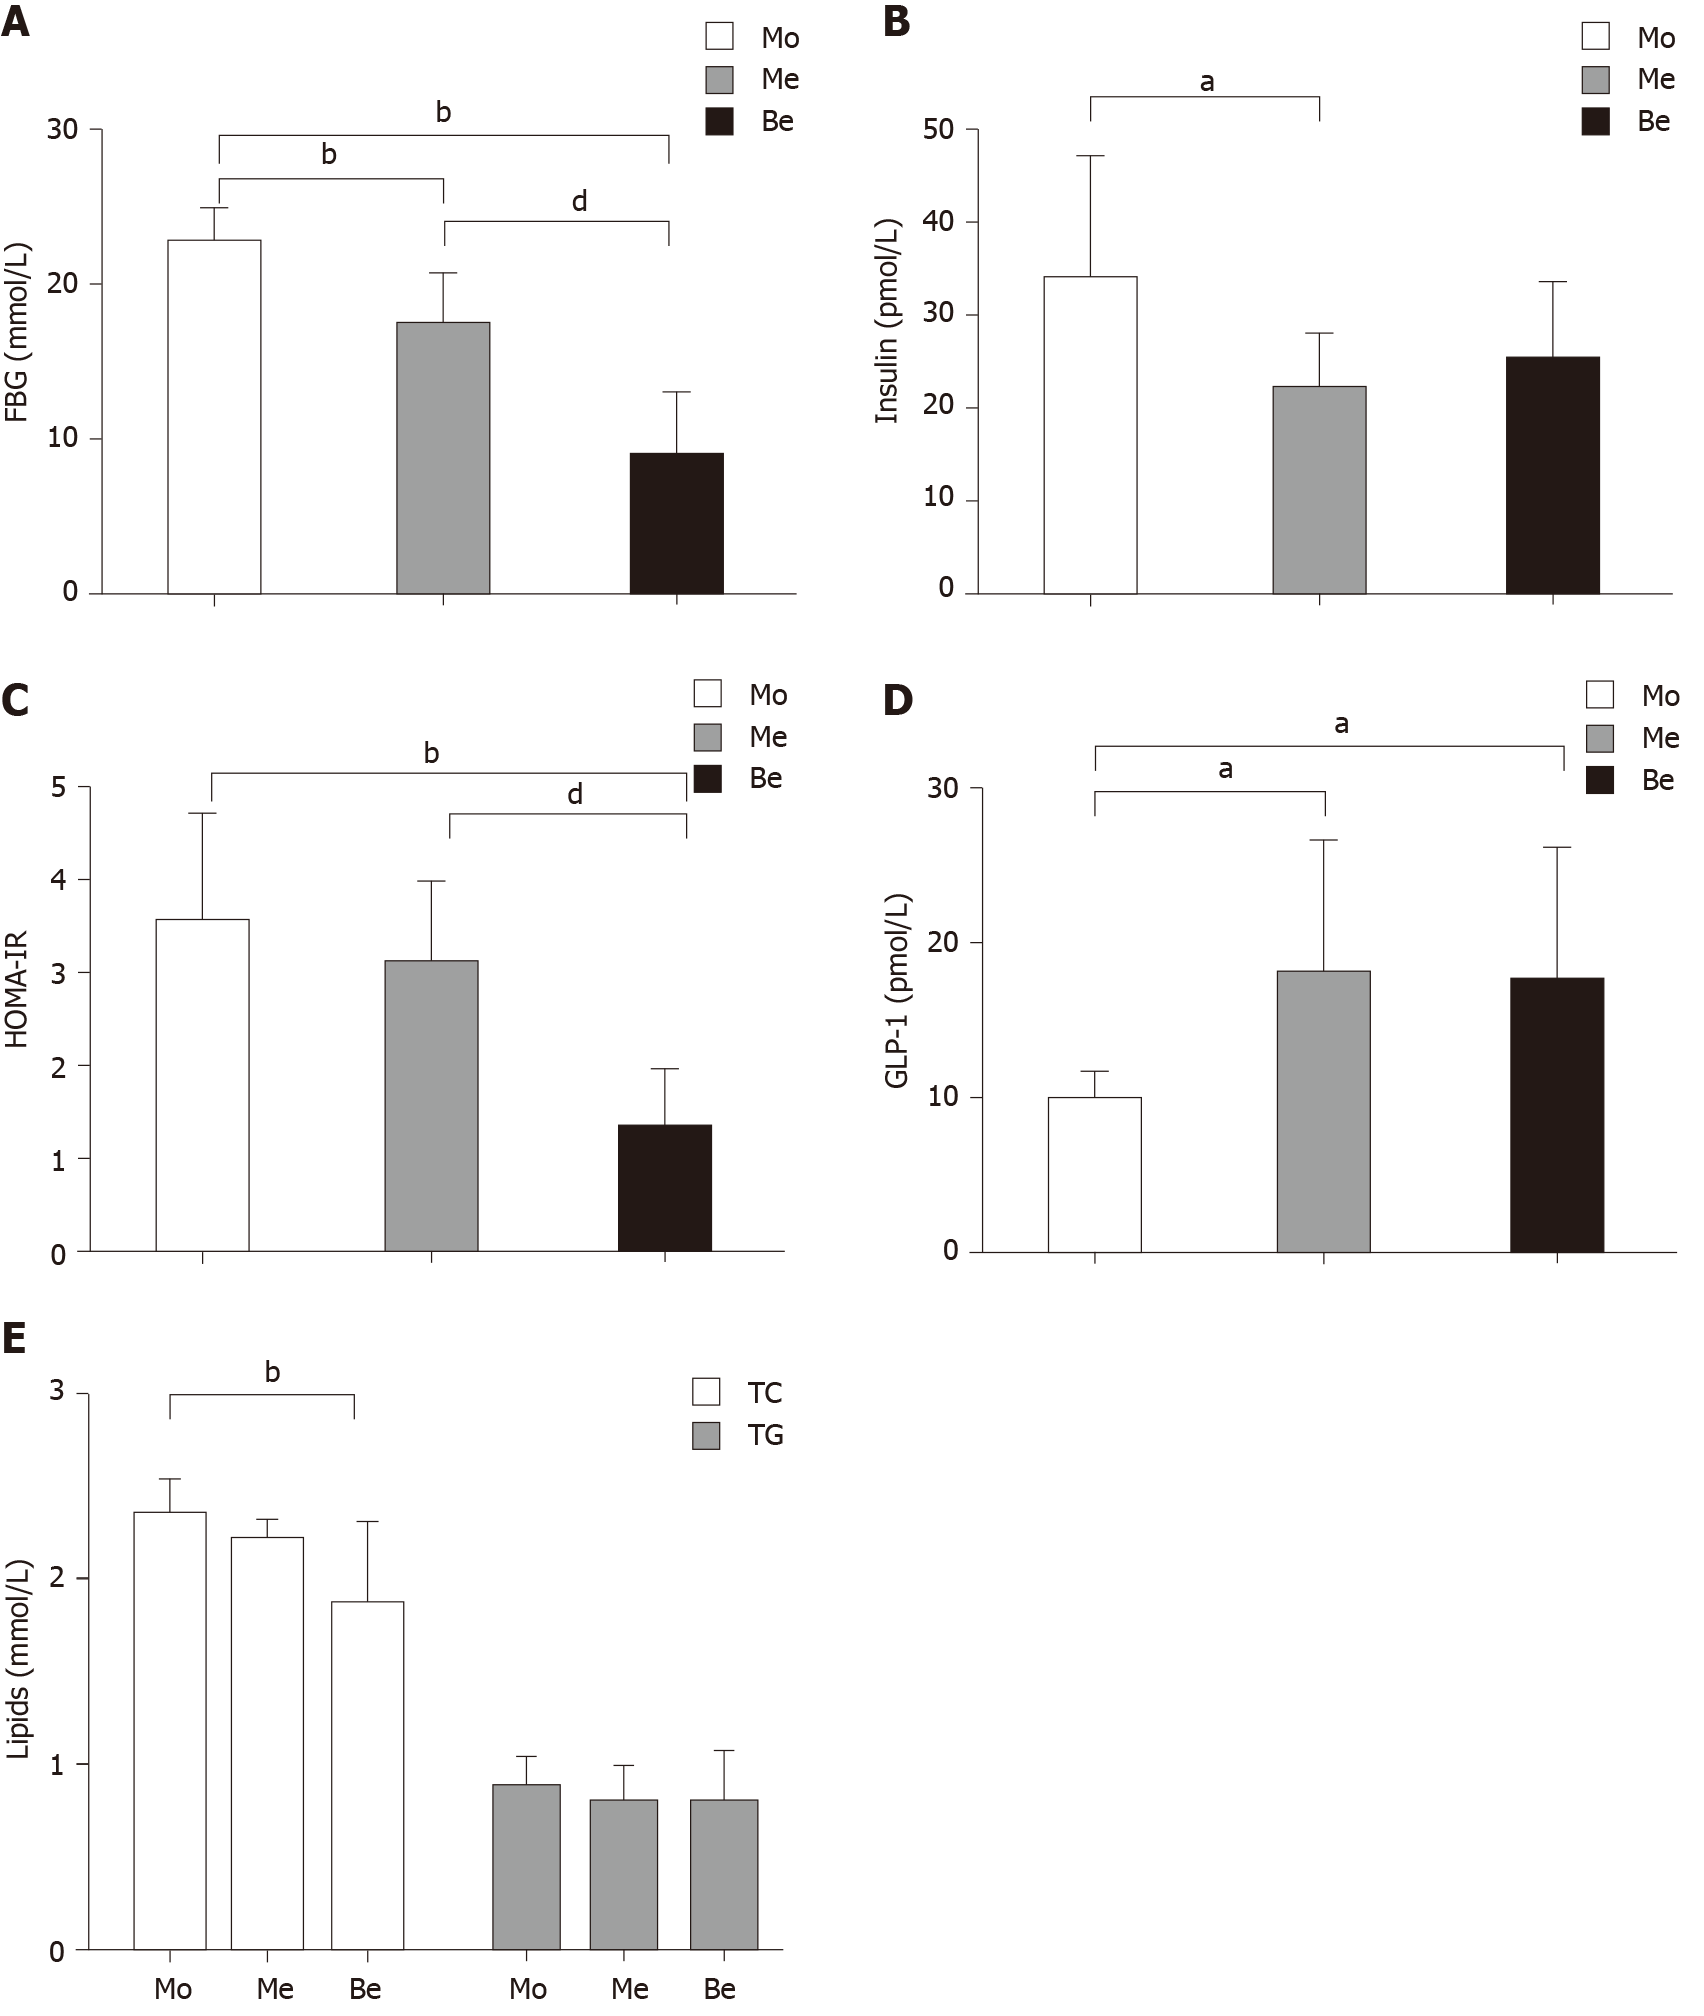
Figure 2 Body weight and metabolic parameter levels after treatment.
A: Comparison of the fasting FBG levels. bP < 0.01 vs the model (Mo) group; dP < 0.01 vs the metformin (Me) group; B: Comparison of the insulin levels. aP < 0.05 vs the Mo group; C: Comparison of the homeostatic model assessment-insulin resistance levels. bP < 0.01 vs the Mo group; dP < 0.05 vs the Me group; D: Comparison of the glucagon-like peptide-1 levels. aP < 0.05 vs the Mo group; E: Comparison of the lipid levels. bP < 0.01 vs the Mo group. FBG: Fasting blood glucose; HOMA-IR: Homeostatic model assessment-insulin resistance; GLP-1: Glucagon-like peptide-1; TC: Total cholesterol; TG: Triglycerides; Mo: Model group; Me: Metformin group; Be: Berberine group.
- Citation: Zhao JD, Li Y, Sun M, Yu CJ, Li JY, Wang SH, Yang D, Guo CL, Du X, Zhang WJ, Cheng RD, Diao XC, Fang ZH. Effect of berberine on hyperglycaemia and gut microbiota composition in type 2 diabetic Goto-Kakizaki rats. World J Gastroenterol 2021; 27(8): 708-724
- URL: https://www.wjgnet.com/1007-9327/full/v27/i8/708.htm
- DOI: https://dx.doi.org/10.3748/wjg.v27.i8.708


