Copyright
©The Author(s) 2021.
World J Gastroenterol. Feb 7, 2021; 27(5): 391-403
Published online Feb 7, 2021. doi: 10.3748/wjg.v27.i5.391
Published online Feb 7, 2021. doi: 10.3748/wjg.v27.i5.391
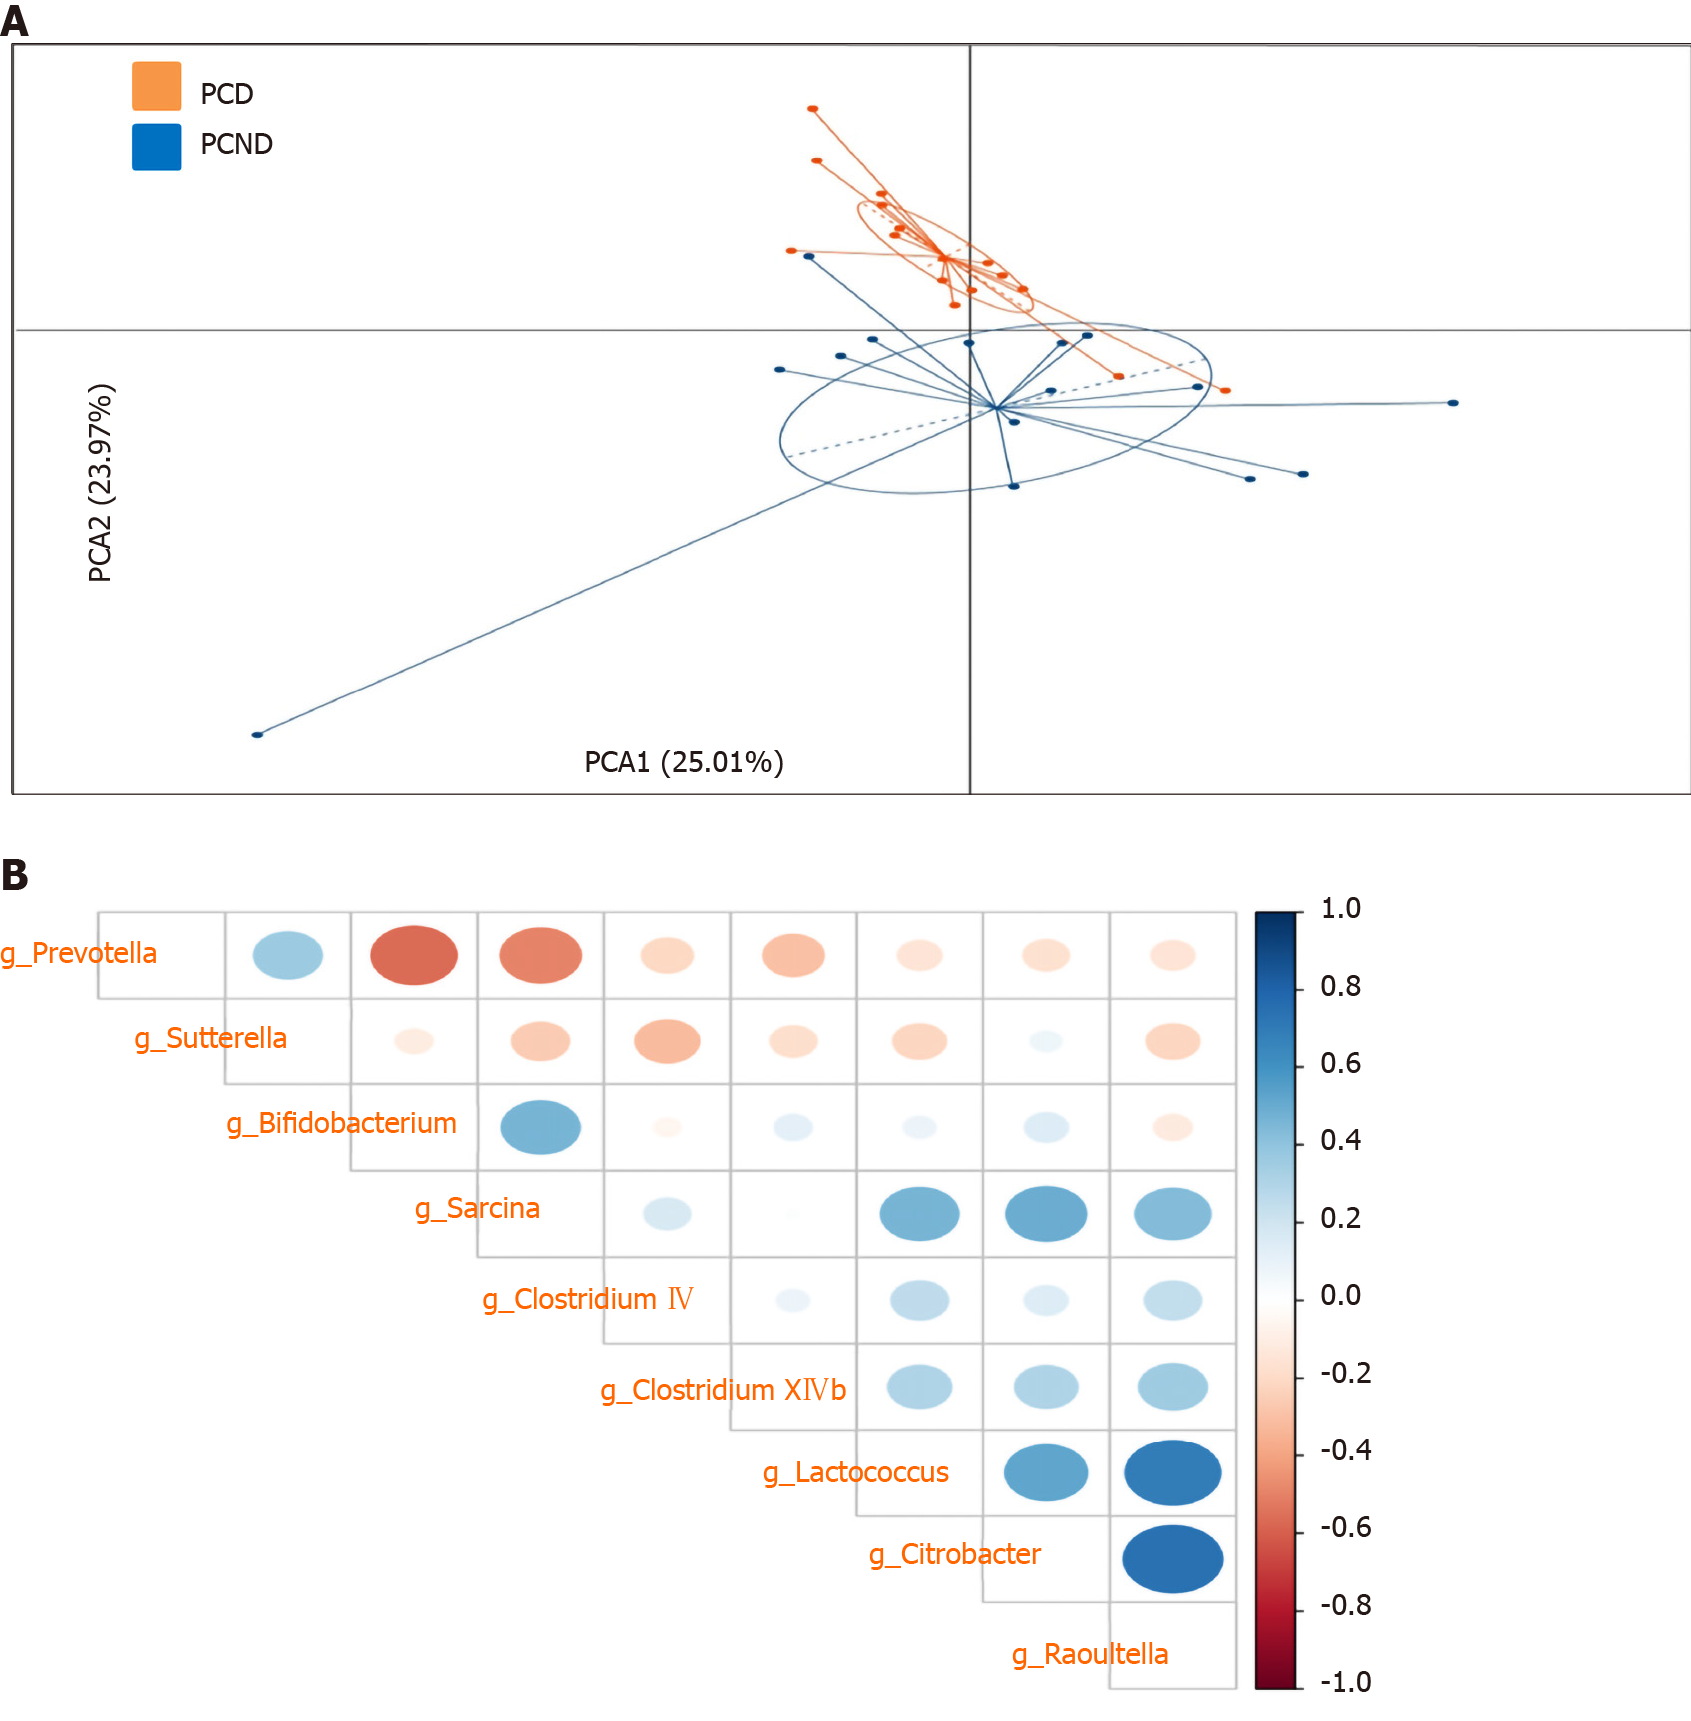
Figure 3 Principal component analyses and correlation plots of different microbial taxa in the post-cholecystectomy diarrhea and post-cholecystectomy non-diarrhea groups.
A: Principal component analysis plot of different taxa in the post-cholecystectomy diarrhea and post-cholecystectomy non-diarrhea groups; B: Spearman’s correlation plots of the relative abundances of the differentially abundant bacteria at the genus level. Statistical significance was determined for all pairwise comparisons. Positive values (blue circles) indicate positive correlations, and negative values (red circles) indicate negative correlations. The shade and size of each circle indicate the magnitude of the correlation (with darker shades indicating higher correlations). PCD: Post-cholecystectomy diarrhea; PCND: Post-cholecystectomy non-diarrhea.
- Citation: Li YD, Liu BN, Zhao SH, Zhou YL, Bai L, Liu EQ. Changes in gut microbiota composition and diversity associated with post-cholecystectomy diarrhea. World J Gastroenterol 2021; 27(5): 391-403
- URL: https://www.wjgnet.com/1007-9327/full/v27/i5/391.htm
- DOI: https://dx.doi.org/10.3748/wjg.v27.i5.391


