Copyright
©The Author(s) 2021.
World J Gastroenterol. Feb 7, 2021; 27(5): 391-403
Published online Feb 7, 2021. doi: 10.3748/wjg.v27.i5.391
Published online Feb 7, 2021. doi: 10.3748/wjg.v27.i5.391
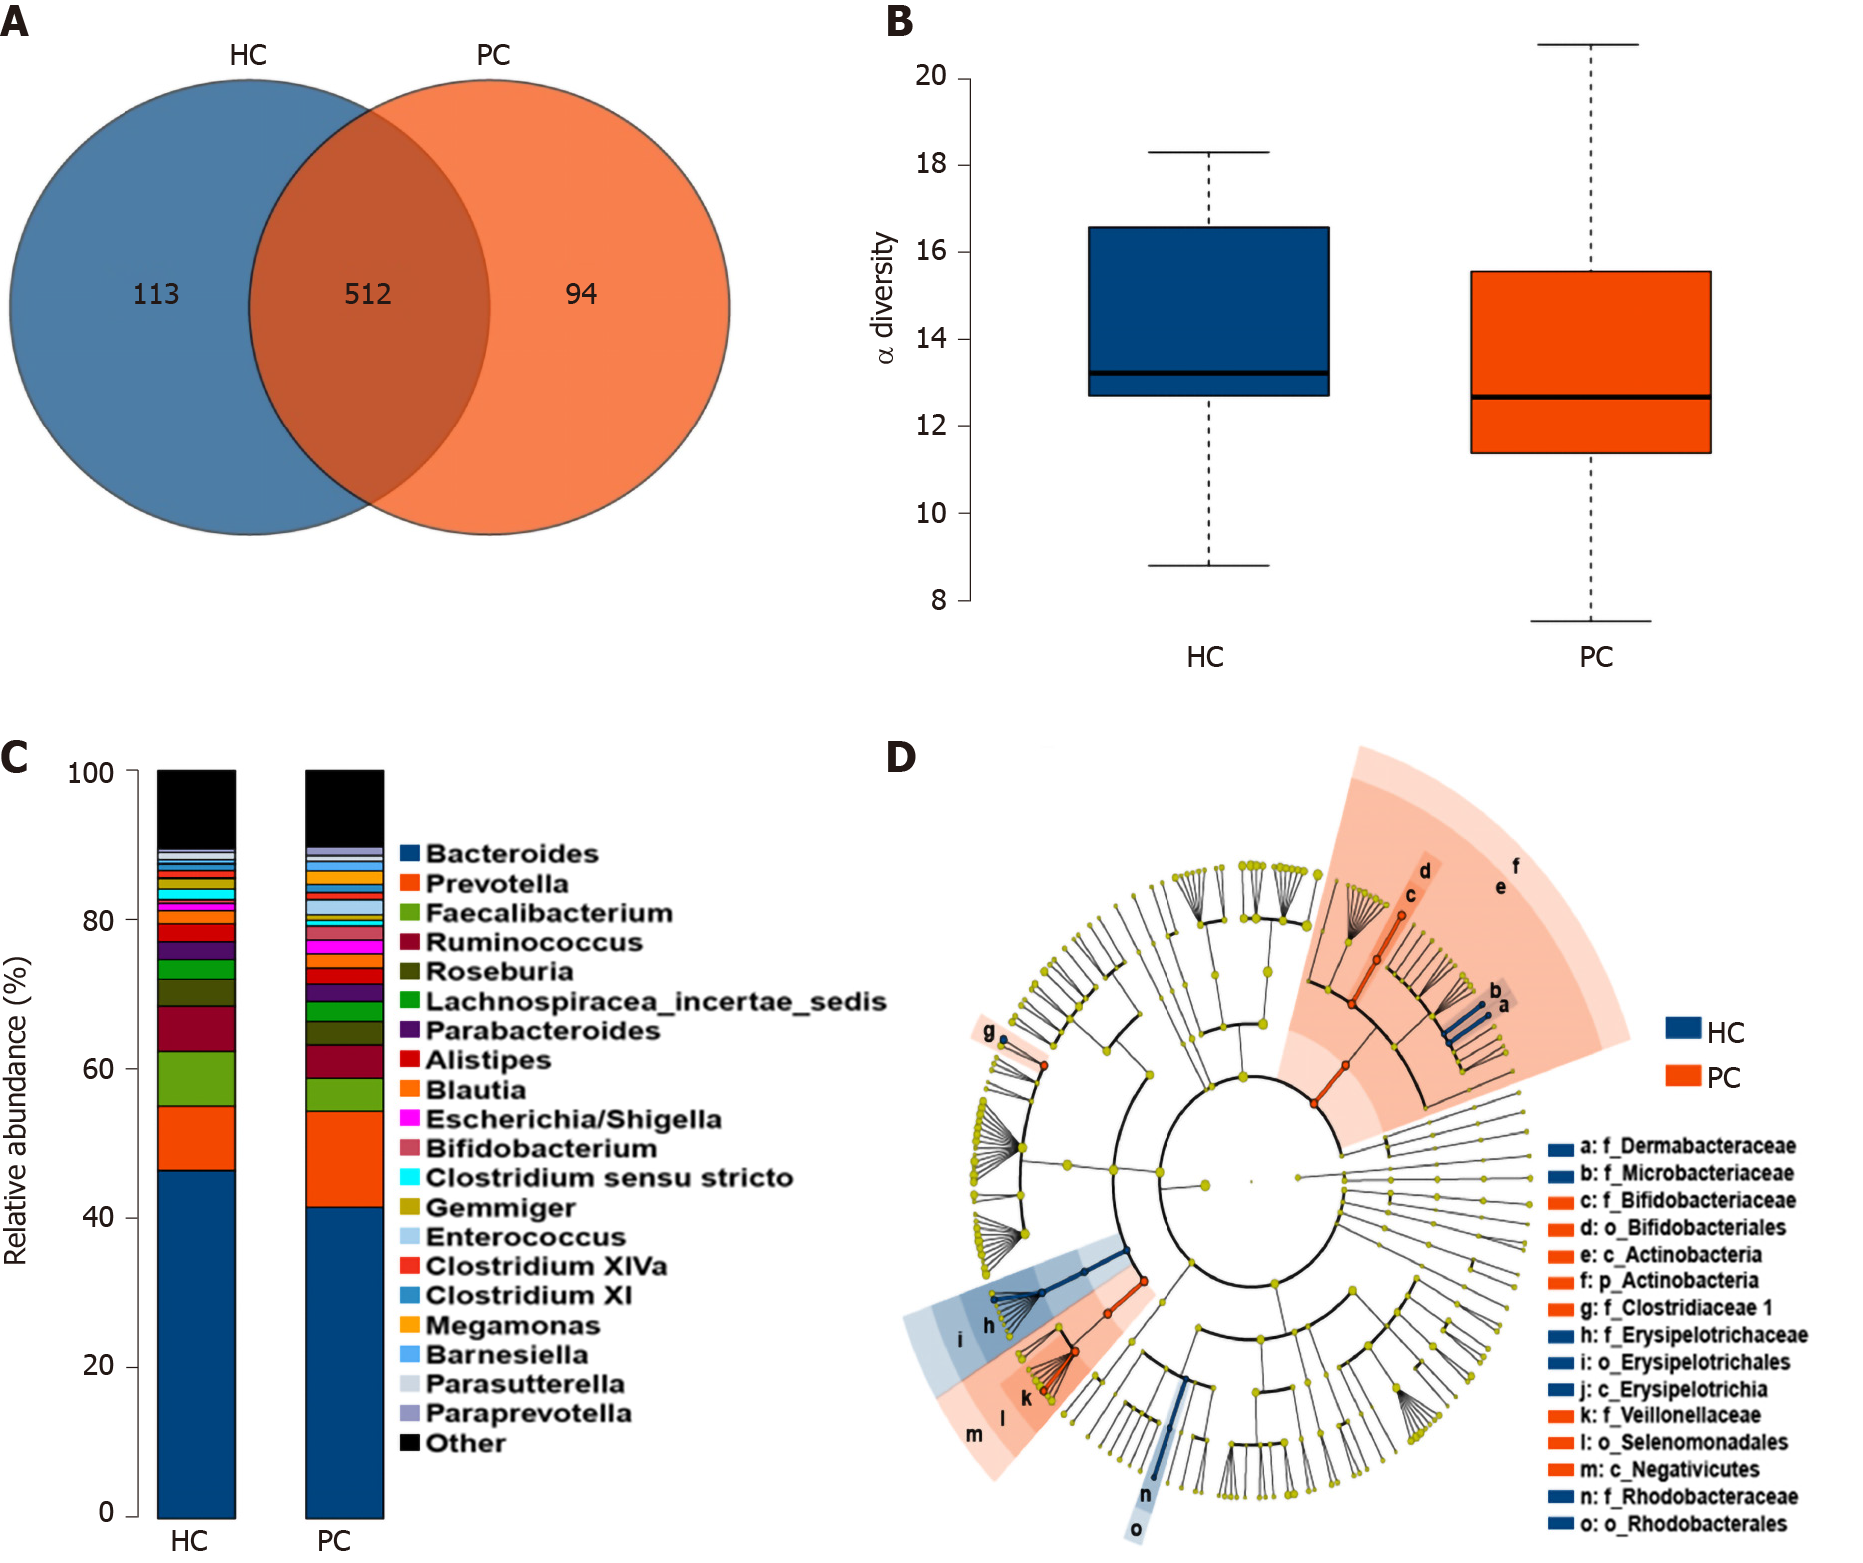
Figure 1 Comparison of gut microbiota structure and abundance between the healthy control and post-cholecystectomy groups.
A: Venn diagram comparing the operational taxonomic units in the fecal microbiota between the two groups; B: Phylogenetic diversity tree used to estimate the diversity of the gut microbiota; C: Profiling of bacterial taxa at the genus level; D: Logarithmic linear discriminant analysis score identifying the taxa with the greatest differences in abundance between the healthy control and post-cholecystectomy groups. The brightness of each dot is proportional to the effect size. HC: Healthy control; PC: Post-cholecystectomy.
- Citation: Li YD, Liu BN, Zhao SH, Zhou YL, Bai L, Liu EQ. Changes in gut microbiota composition and diversity associated with post-cholecystectomy diarrhea. World J Gastroenterol 2021; 27(5): 391-403
- URL: https://www.wjgnet.com/1007-9327/full/v27/i5/391.htm
- DOI: https://dx.doi.org/10.3748/wjg.v27.i5.391


