Copyright
©The Author(s) 2021.
World J Gastroenterol. Dec 28, 2021; 27(48): 8323-8342
Published online Dec 28, 2021. doi: 10.3748/wjg.v27.i48.8323
Published online Dec 28, 2021. doi: 10.3748/wjg.v27.i48.8323
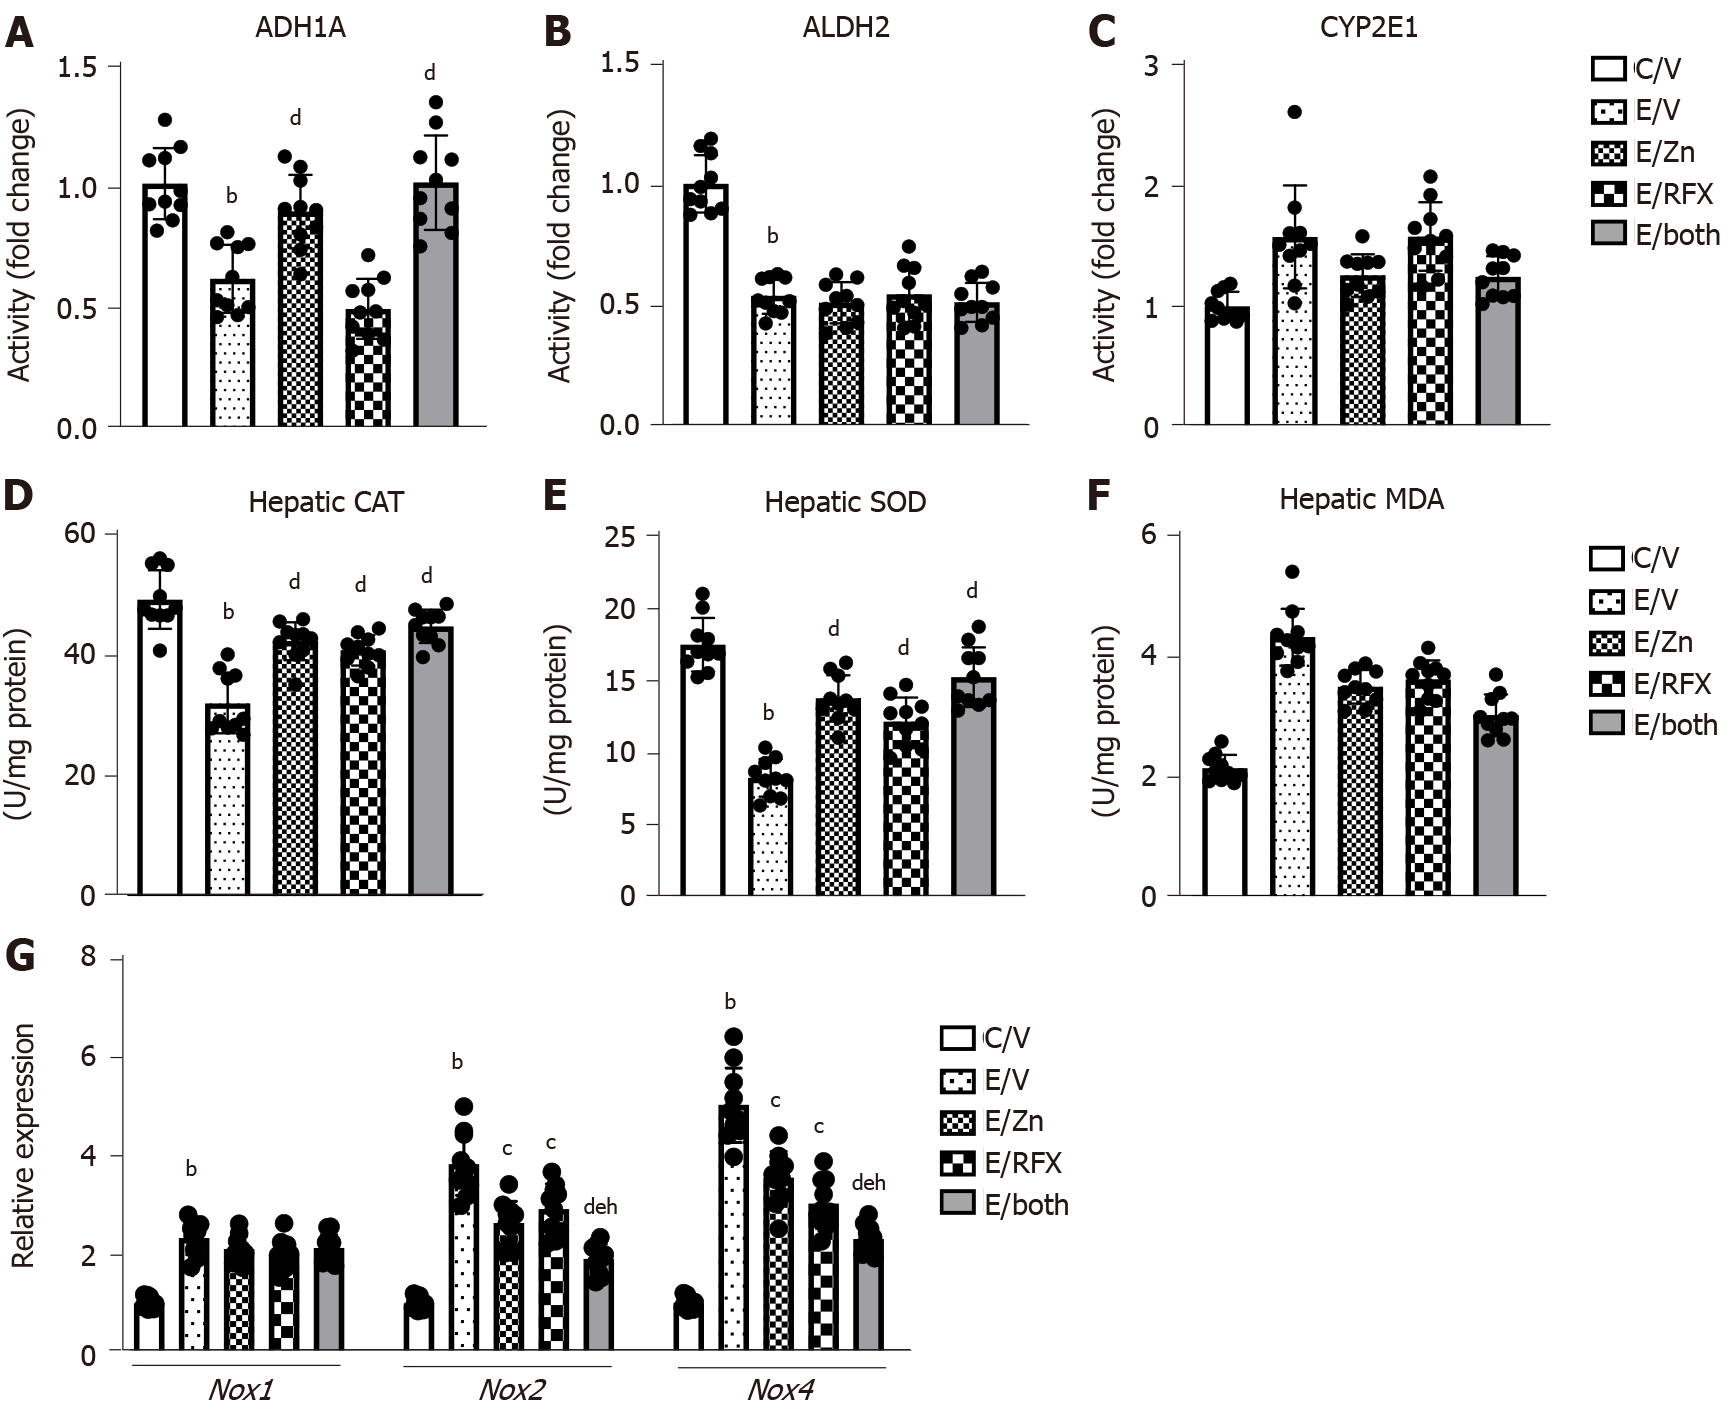
Figure 2 Zinc acetate and rifaximin on ethanol metabolism and accumulation of oxidative stress in alcoholic liver disease mice.
A-C: Hepatic activity of alcohol dehydrogenase 1 (A), aldehyde dehydrogenase 2 (B) and cytochrome P450 2E1 (CYP2E1) (C). Quantitative values are indicated as fold changes to the values of C/V group; D-F: Hepatic levels of of catalase (D), superoxide dismutase (E) and malondialdehyde (F); G: Relative mRNA expression levels of Nox1, Nox2 and Nox4 in the liver of experimental mice. The mRNA expression levels were measured by RT-qPCR, and Gapdh was used as internal control. Quantitative values are indicated as fold changes to the values of C/V group. Data are mean ± SD (n = 10), aP < 0.05 and bP < 0.01 vs C/V group; cP < 0.05 and dP < 0.01 vs E/V group; eP < 0.05 and fP < 0.01 vs E/Zn group; gP < 0.05 and hP < 0.01 vs E/RFX group. ADH1: Alcohol dehydrogenase 1; ALDH2: Aldehyde dehydrogenase 2; CAT: Catalase; SOD: Superoxide dismutase; MDA: Malondialdehyde.
- Citation: Fujimoto Y, Kaji K, Nishimura N, Enomoto M, Murata K, Takeda S, Takaya H, Kawaratani H, Moriya K, Namisaki T, Akahane T, Yoshiji H. Dual therapy with zinc acetate and rifaximin prevents from ethanol-induced liver fibrosis by maintaining intestinal barrier integrity. World J Gastroenterol 2021; 27(48): 8323-8342
- URL: https://www.wjgnet.com/1007-9327/full/v27/i48/8323.htm
- DOI: https://dx.doi.org/10.3748/wjg.v27.i48.8323


