Copyright
©The Author(s) 2021.
World J Gastroenterol. Dec 28, 2021; 27(48): 8323-8342
Published online Dec 28, 2021. doi: 10.3748/wjg.v27.i48.8323
Published online Dec 28, 2021. doi: 10.3748/wjg.v27.i48.8323
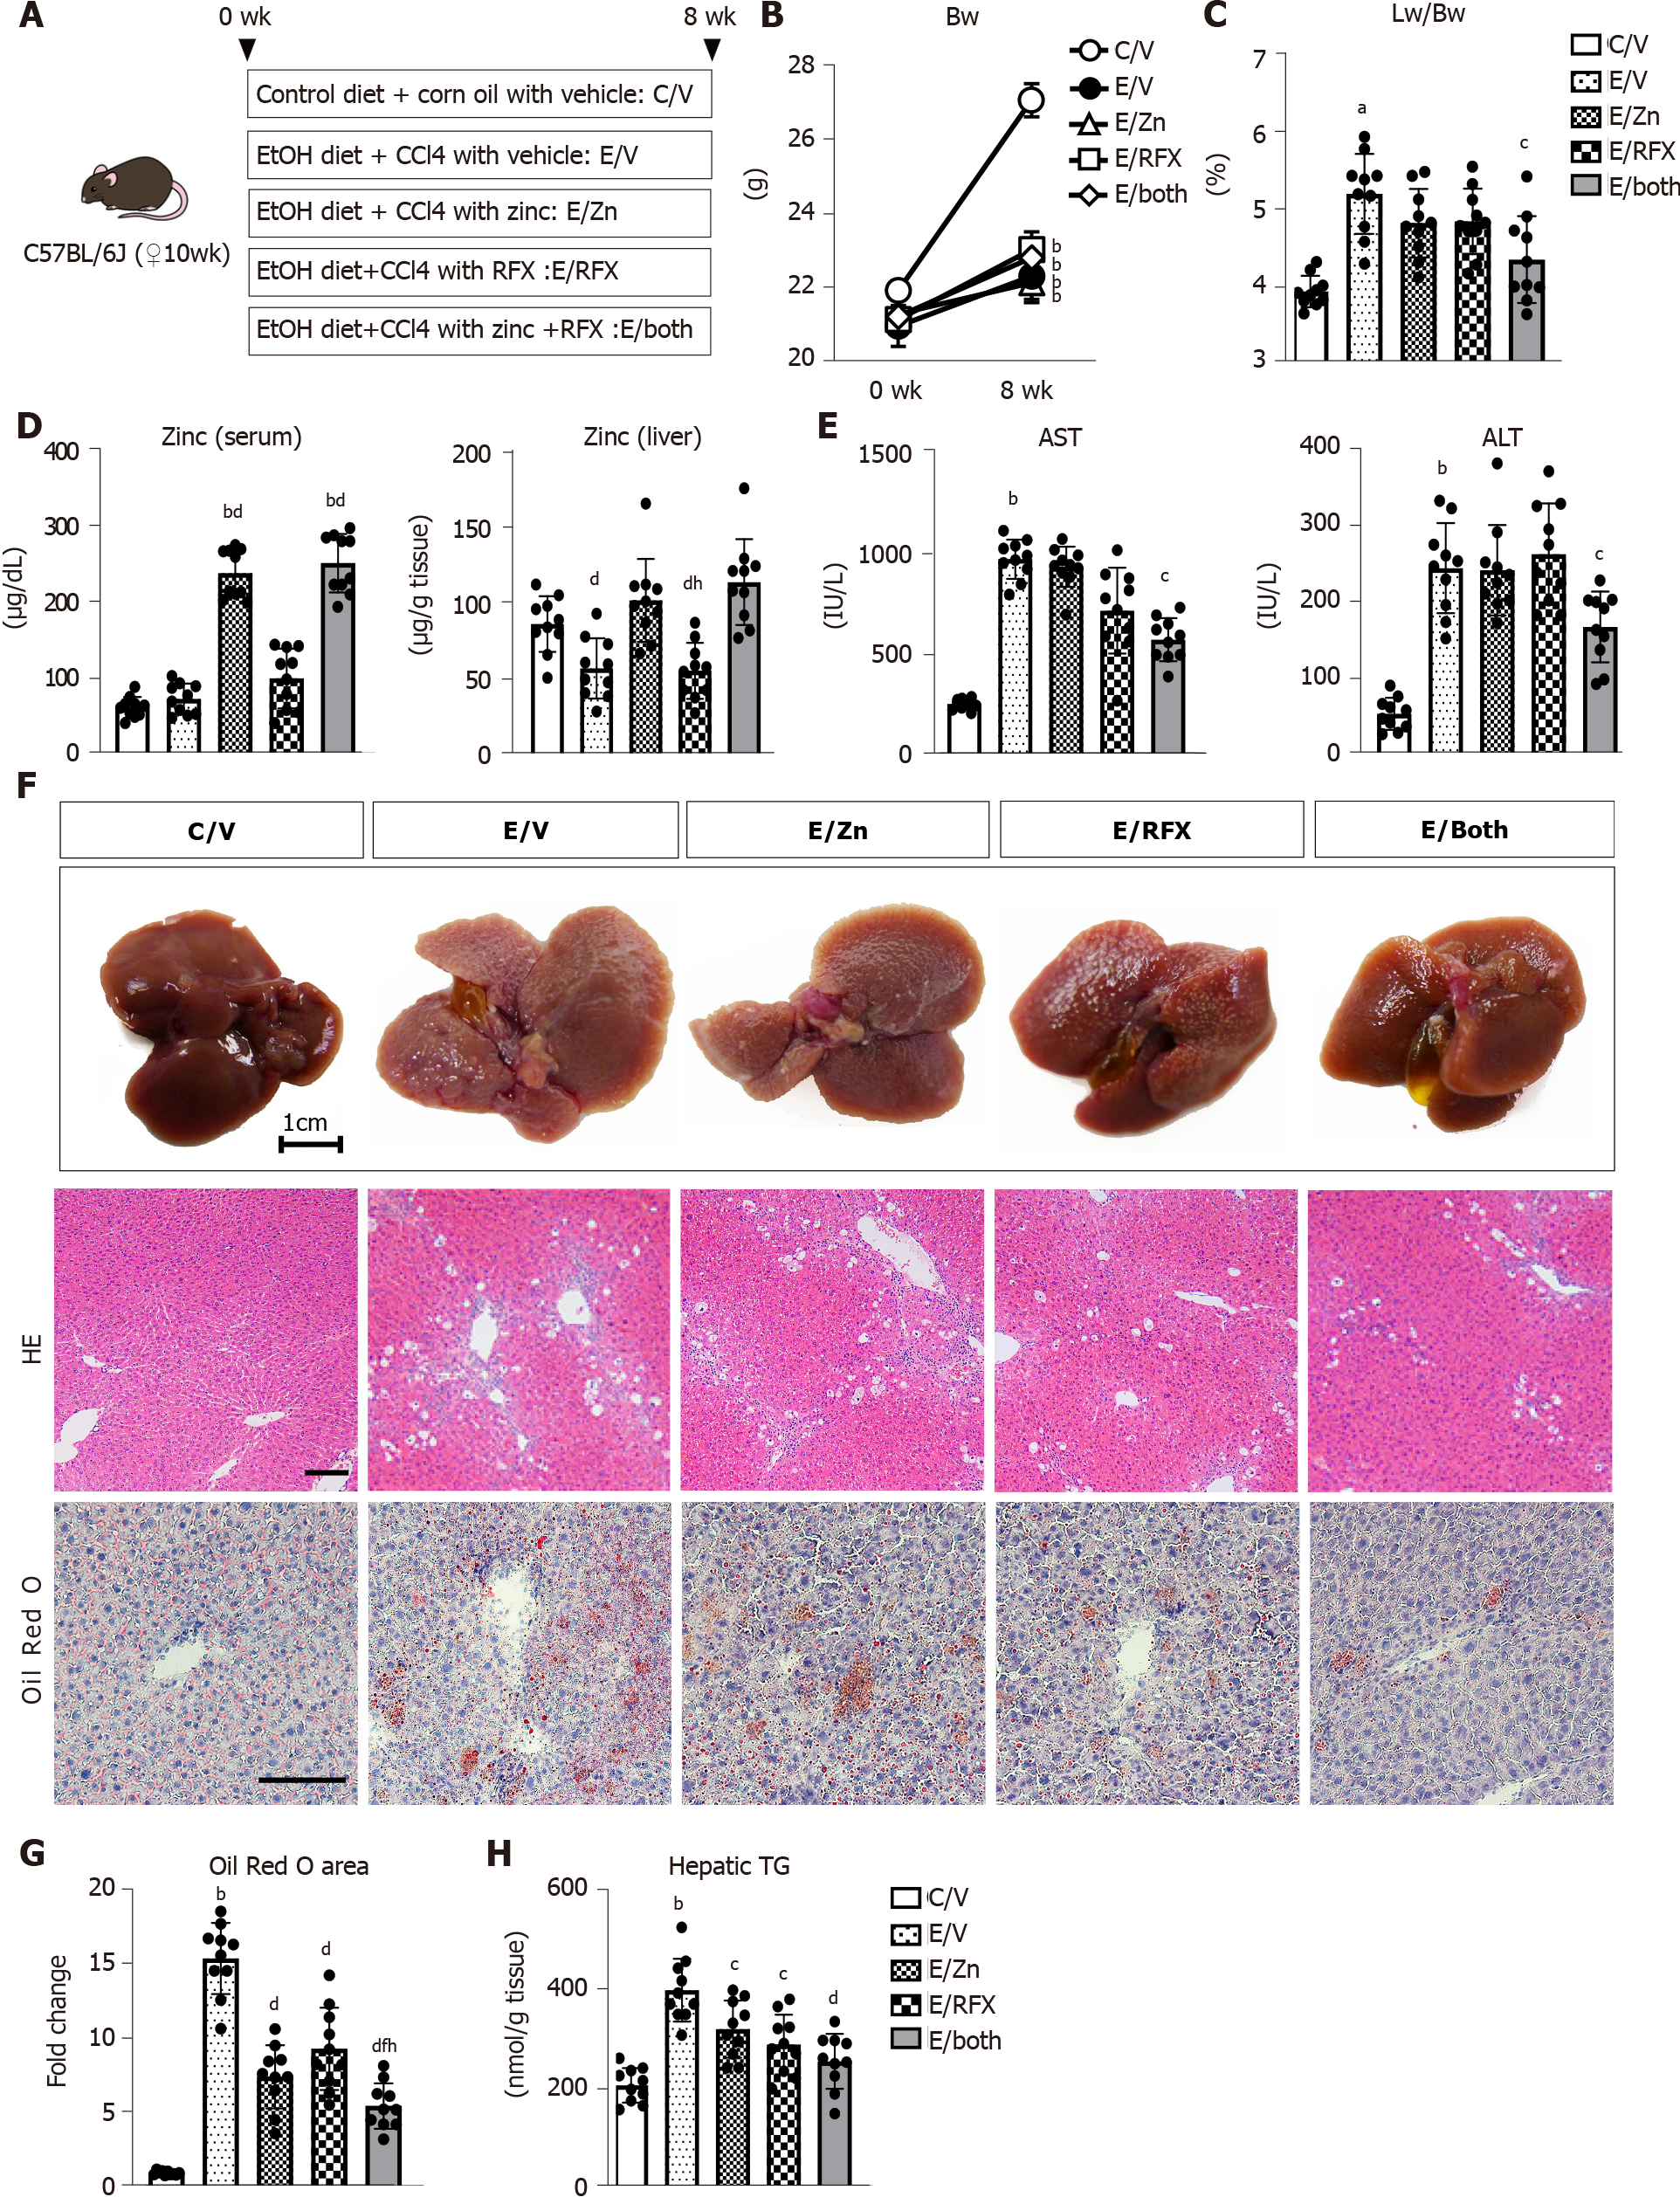
Figure 1 Zinc acetate and rifaximin against hepatic steatosis in alcoholic liver disease mice.
A: Experimental protocols; B: Changes in body weights during experimental period; C: Ratio of liver weight to body weight at the end of experiment; D: Zinc concentrations of the serum (left) and the liver (right); E: Serum levels of aspartate aminotransferase (left) and alanine aminotransferase (right); F: Representative macroscopic appearances (upper), microphotographs of hematoxylin and eosin (middle) and Oil Red O staining (lower) of the livers in the experimental mice. Scale bar: 25 μm; G: Semi-quantification of lipid accumulation stained by Oil Red O in high-power field by NIH imageJ software. Histochemical quantitative analyses included five fields per section. Quantitative values are indicated as fold changes to the values of C/V group; H: Hepatic concentrations of triglyceride. Data are mean ± SD (n = 10), aP < 0.05 and bP < 0.01 vs C/V group; cP < 0.05 and dP < 0.01 vs E/V group; eP < 0.05 and fP < 0.01 vs E/Zn group; gP < 0.05 and hP < 0.01 vs E/RFX group. AST: Aspartate aminotransferase; ALT: Alanine aminotransferase; HE: Hematoxylin and eosin.
- Citation: Fujimoto Y, Kaji K, Nishimura N, Enomoto M, Murata K, Takeda S, Takaya H, Kawaratani H, Moriya K, Namisaki T, Akahane T, Yoshiji H. Dual therapy with zinc acetate and rifaximin prevents from ethanol-induced liver fibrosis by maintaining intestinal barrier integrity. World J Gastroenterol 2021; 27(48): 8323-8342
- URL: https://www.wjgnet.com/1007-9327/full/v27/i48/8323.htm
- DOI: https://dx.doi.org/10.3748/wjg.v27.i48.8323


