Copyright
©The Author(s) 2021.
World J Gastroenterol. Dec 21, 2021; 27(47): 8156-8165
Published online Dec 21, 2021. doi: 10.3748/wjg.v27.i47.8156
Published online Dec 21, 2021. doi: 10.3748/wjg.v27.i47.8156
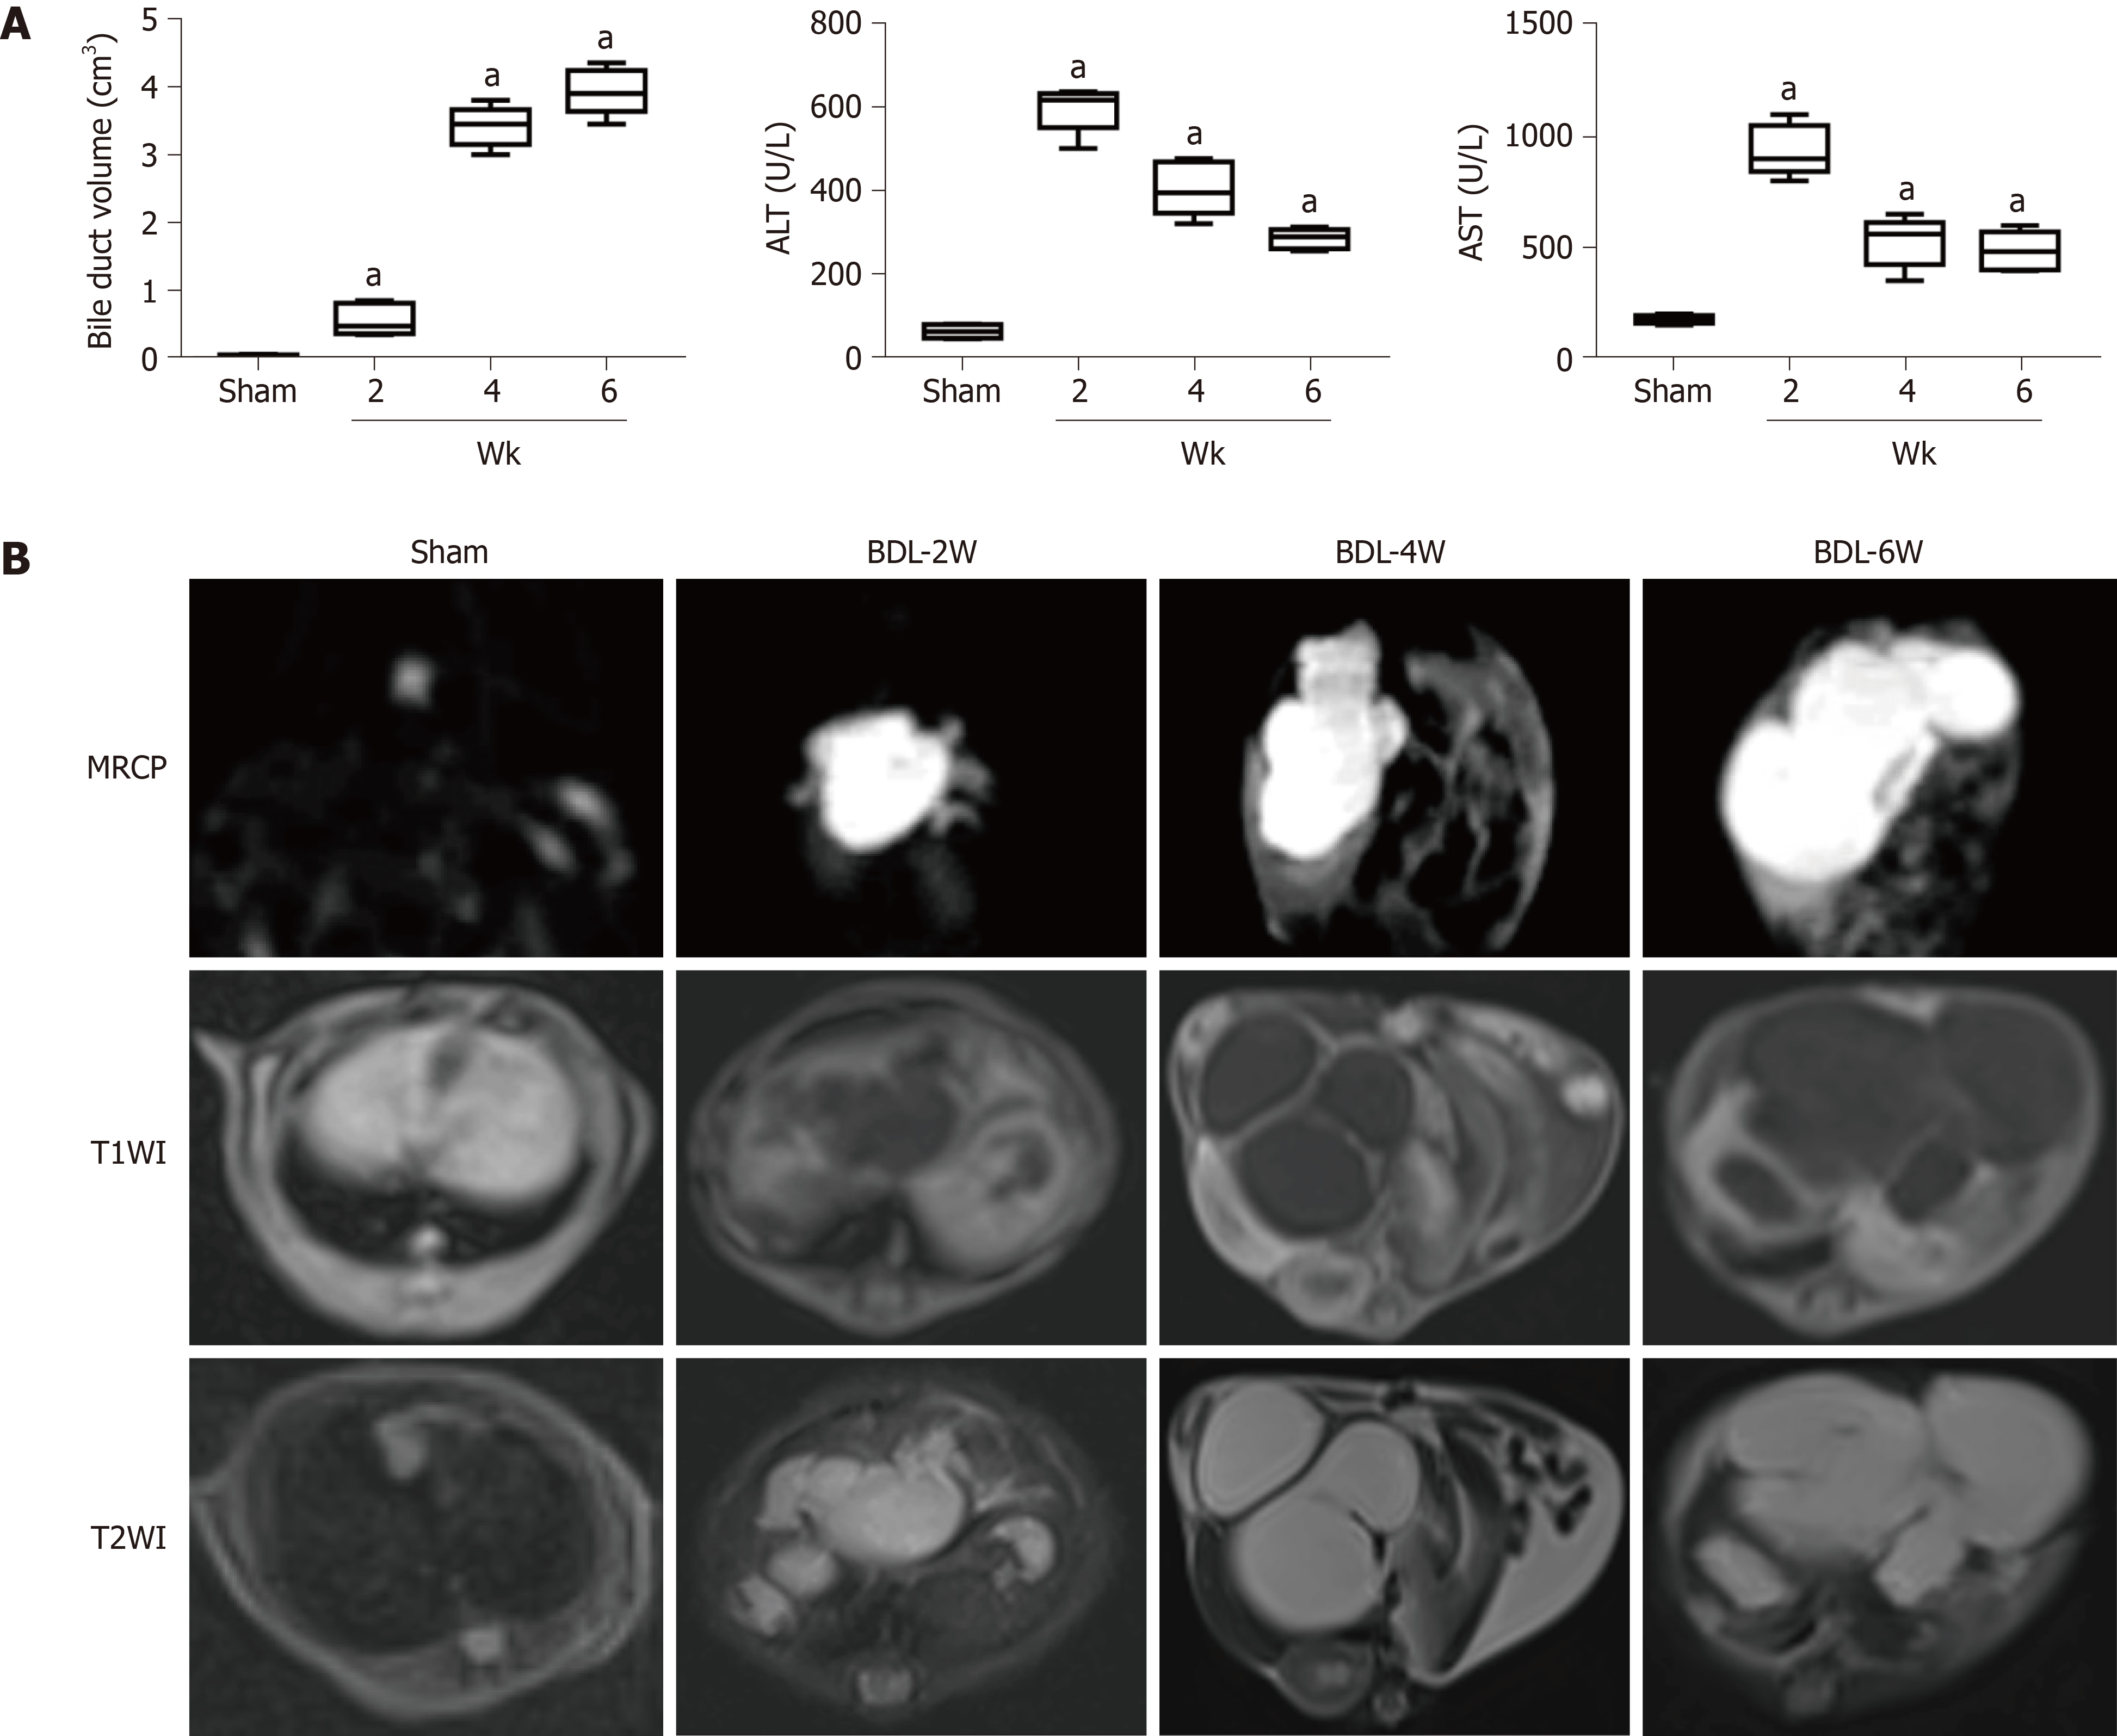
Figure 2 Magnetic resonance imaging findings and quantitative analysis.
A: Box diagram of bile duct volume, ALT and AST in sham and BDL subgroups; B: Maximum cross-section of the bile duct or gallbladder on MRCP, T1-weighted, and T2-weighted images in sham and BDL subgroups. BDL: Bile duct ligation; MRCP: Magnetic resonance cholangiopancreatography; ALT: Alanine aminotransferase; AST: Aspartate transaminase. aP < 0.01 for comparison between and sham and liver fibrosis subgroups.
- Citation: Liu JY, Ding ZY, Zhou ZY, Dai SZ, Zhang J, Li H, Du Q, Cai YY, Shang QL, Luo YH, Xiao EH. Multiparameter magnetic resonance imaging of liver fibrosis in a bile duct ligation mouse model. World J Gastroenterol 2021; 27(47): 8156-8165
- URL: https://www.wjgnet.com/1007-9327/full/v27/i47/8156.htm
- DOI: https://dx.doi.org/10.3748/wjg.v27.i47.8156


