Copyright
©The Author(s) 2021.
World J Gastroenterol. Dec 14, 2021; 27(46): 7866-7893
Published online Dec 14, 2021. doi: 10.3748/wjg.v27.i46.7866
Published online Dec 14, 2021. doi: 10.3748/wjg.v27.i46.7866
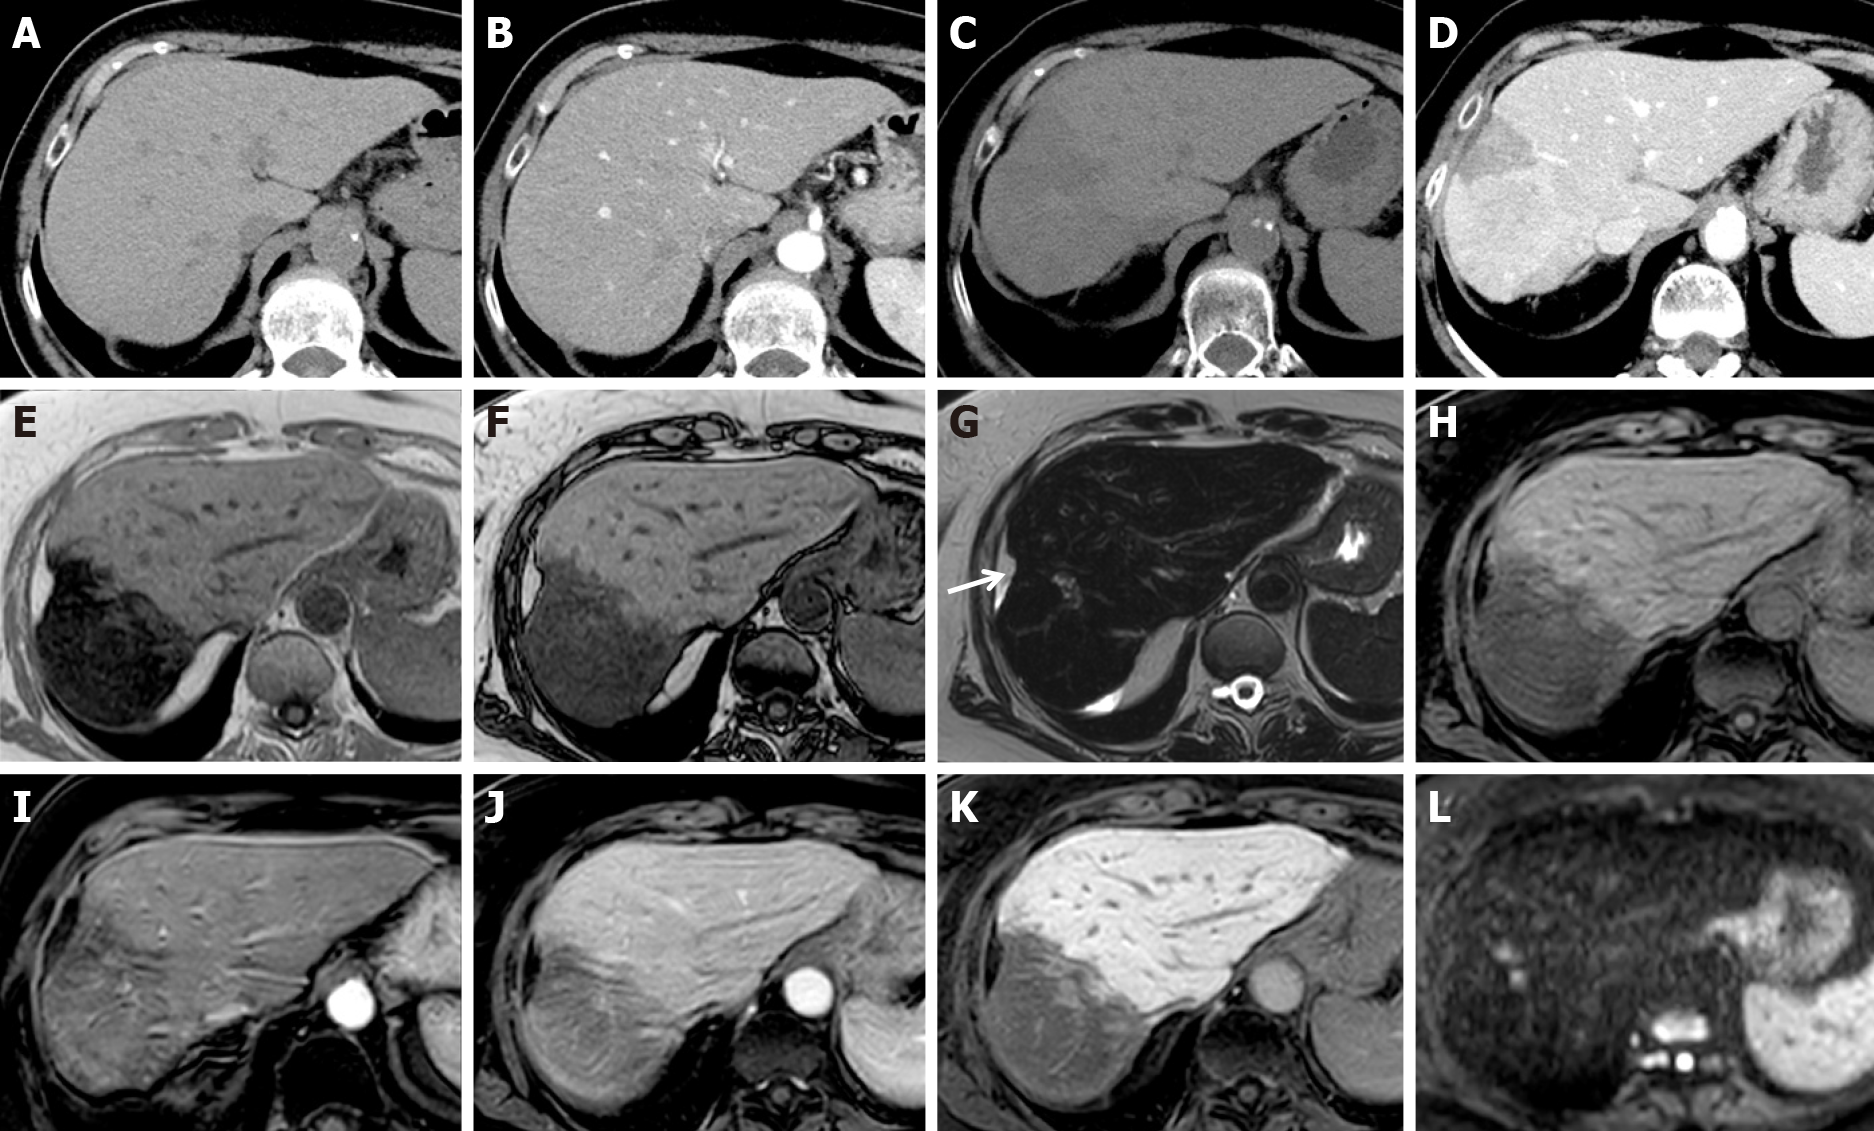
Figure 3 Liver metabolic infarction areas in patients with breast cancer.
A, B: Unenhanced (A) and arterial phase (B) computed tomography (CT) axial scan before therapy show normal liver; C, D: Unenhanced (C) and late arterial phase (D) CT axial scans after 3 mo of therapy show early steatotic changes of the parenchyma and inhomogeneous enhancement in segments VII-VIII; E-L: Magnetic resonance after 6 mo of therapy shows progression of parenchymal involution and atrophy in gradient echo (GE) T1w in-phase (E), GE T1w out-of-phase (F), fat sat GE 3D T1w unenhanced (H), arterial (I), portal (J) and hepatobiliary phase (K). Capsular retraction is seen (white arrow). On T2w (G), and high b-value diffusion-weighted (L) images, no signal alteration was detectable.
- Citation: Calistri L, Rastrelli V, Nardi C, Maraghelli D, Vidali S, Pietragalla M, Colagrande S. Imaging of the chemotherapy-induced hepatic damage: Yellow liver, blue liver, and pseudocirrhosis. World J Gastroenterol 2021; 27(46): 7866-7893
- URL: https://www.wjgnet.com/1007-9327/full/v27/i46/7866.htm
- DOI: https://dx.doi.org/10.3748/wjg.v27.i46.7866


