Copyright
©The Author(s) 2021.
World J Gastroenterol. Nov 21, 2021; 27(43): 7509-7529
Published online Nov 21, 2021. doi: 10.3748/wjg.v27.i43.7509
Published online Nov 21, 2021. doi: 10.3748/wjg.v27.i43.7509
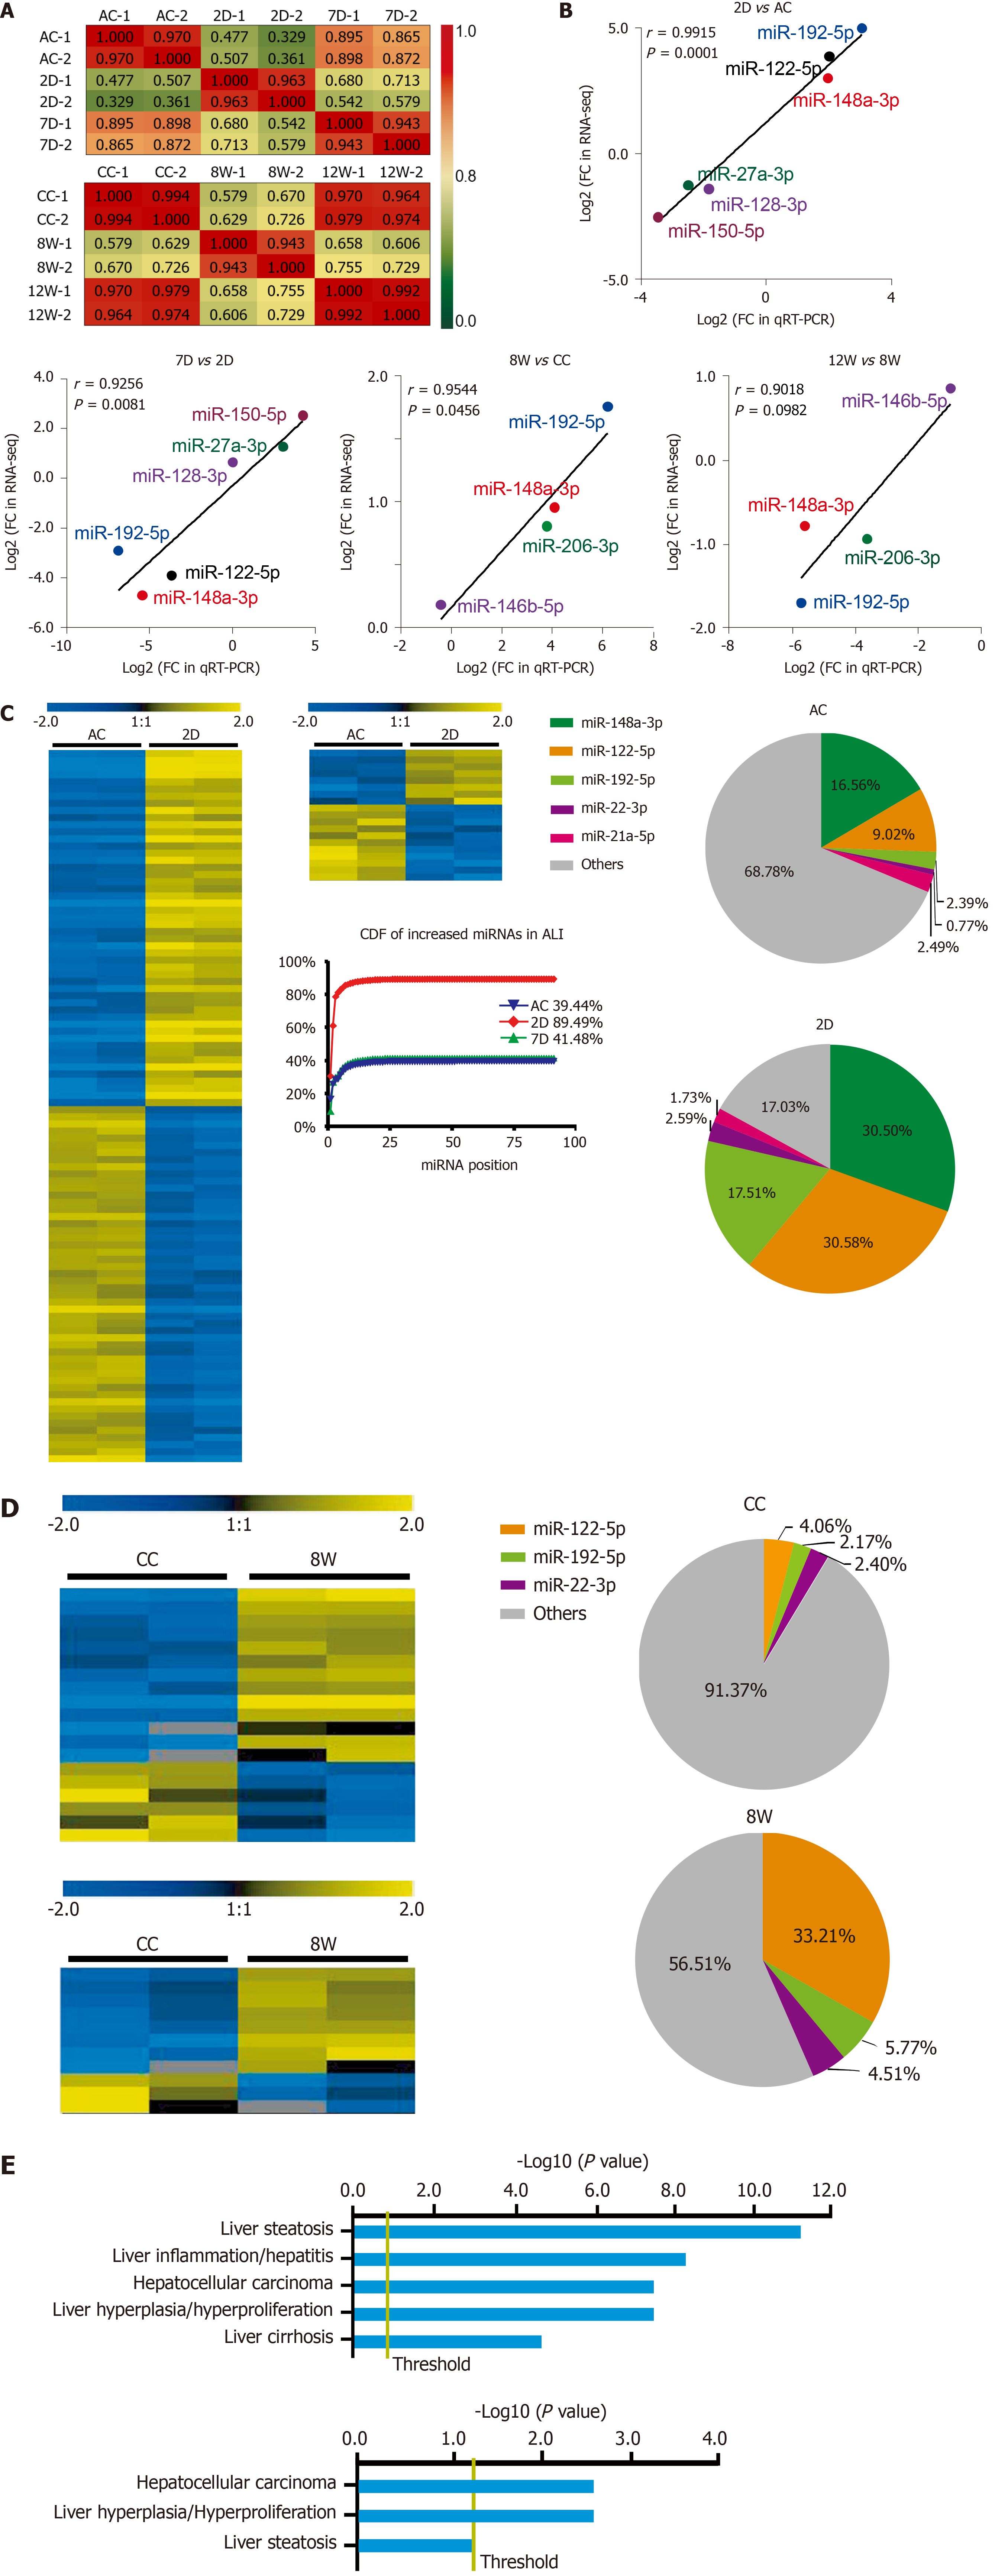
Figure 4 Differentially expressed microRNAs in serum small extracellular vesicles from acute liver injury and chronic liver injury mice and their biological significance.
A: Pearson correlation coefficients between samples from acute liver injury (ALI) and chronic liver injury (CLI). The correlation coefficient values are labeled in the heat map; red or green represents high or low correlation, respectively; B: Validation of RNA sequencing data by quantitative real-time polymerase chain reaction for microRNAs (miRNAs) from ALI and CLI; C: Heatmap for the differentially expressed miRNAs in the ALI injury stage (2 d vs ALI control) and recovery stage (7 d vs ALI control), a cumulative distribution frequency plot for the increased miRNAs in ALI, and pie charts illustrating the proportions of the top five upregulated miRNAs in the ALI control and 2 d groups; D: Heatmap for the differentially expressed miRNAs in the CLI injury stage (8 wk vs CLI control) and recovery stage (12 wk vs CLI control). The pie charts illustrate the proportions of the top three upregulated miRNAs in the CLI control and 8 wk groups; E: The top hepatotoxicity processes related to the differentially expressed serum sEV miRNAs in ALI (top) and the differentially expressed serum sEV miRNAs in CLI (bottom) cataloged by Ingenuity Pathway Analysis-Tox function analysis. D: Day; W: Week; AC: Acute liver injury control; CC: Chronic liver injury control; ALI: Acute liver injury; CDF: Cumulative distribution frequency; qRT-PCR: Quantitative real-time polymerase chain reaction; FC: Fold change; RNA-seq: RNA sequencing; miRNA: MicroRNA.
- Citation: Lv XF, Zhang AQ, Liu WQ, Zhao M, Li J, He L, Cheng L, Sun YF, Qin G, Lu P, Ji YH, Ji JL. Liver injury changes the biological characters of serum small extracellular vesicles and reprograms hepatic macrophages in mice. World J Gastroenterol 2021; 27(43): 7509-7529
- URL: https://www.wjgnet.com/1007-9327/full/v27/i43/7509.htm
- DOI: https://dx.doi.org/10.3748/wjg.v27.i43.7509


