Copyright
©The Author(s) 2021.
World J Gastroenterol. Nov 21, 2021; 27(43): 7509-7529
Published online Nov 21, 2021. doi: 10.3748/wjg.v27.i43.7509
Published online Nov 21, 2021. doi: 10.3748/wjg.v27.i43.7509
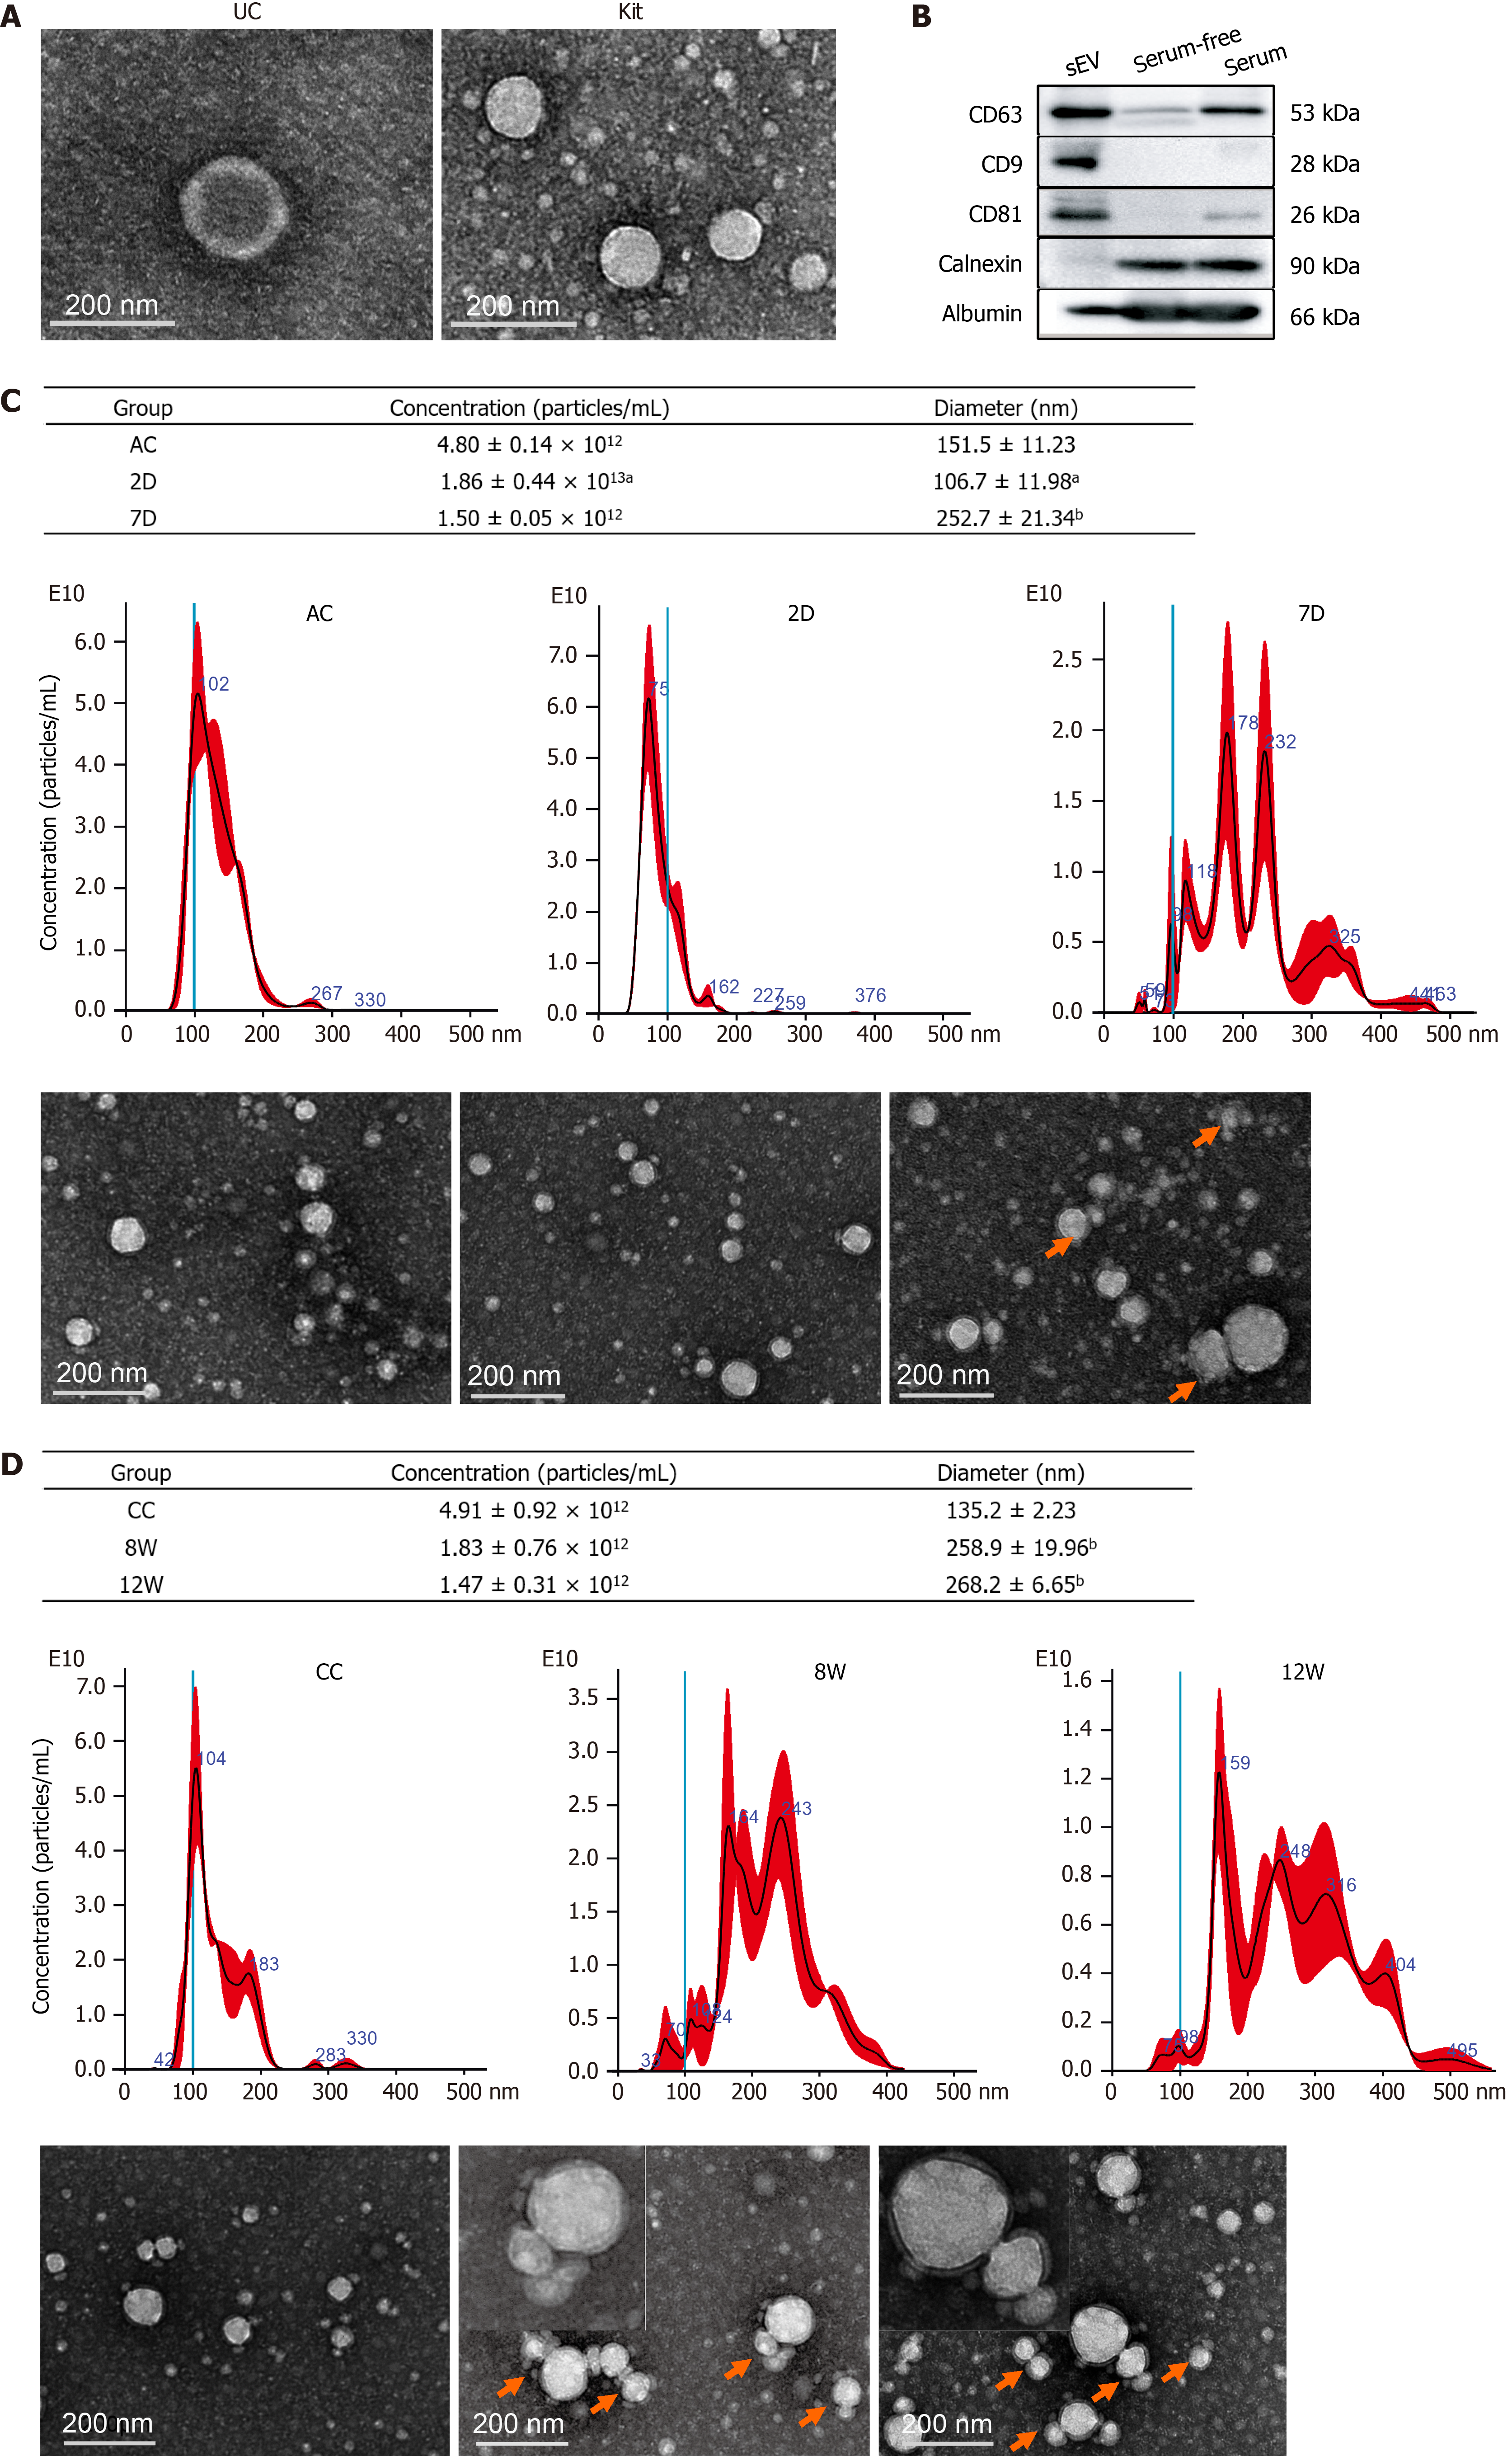
Figure 2 Characterization of isolated mouse serum small extracellular vesicles.
A: Transmission electron microscopy (TEM) images of the particles isolated using ultracentrifugation and an ExoQuick precipitation kit; B: Representative Western blotting bands for CD63, CD81, CD9, calnexin and albumin; C: Nanoparticle tracking analysis (NTA) plots for the size distribution and concentration of the isolated particles in each group from ALI mice and the corresponding TEM images. Compared with the ALI control group, aP < 0.05, bP < 0.01; D: NTA plots for the size distribution and concentration of the isolated particles in each group from CLI mice and the corresponding TEM images. Compared with the CLI control group, bP < 0.01. The red arrow indicates aggregated particles; representative particles were amplified and were exemplified in the top left corner. Scale bar = 200 nm. UC: Ultracentrifuge; D: Day; W: Week; AC: Acute liver injury control; CC: Chronic liver injury control; sEVs: Small extracellular vesicles.
- Citation: Lv XF, Zhang AQ, Liu WQ, Zhao M, Li J, He L, Cheng L, Sun YF, Qin G, Lu P, Ji YH, Ji JL. Liver injury changes the biological characters of serum small extracellular vesicles and reprograms hepatic macrophages in mice. World J Gastroenterol 2021; 27(43): 7509-7529
- URL: https://www.wjgnet.com/1007-9327/full/v27/i43/7509.htm
- DOI: https://dx.doi.org/10.3748/wjg.v27.i43.7509


