Copyright
©The Author(s) 2021.
World J Gastroenterol. Nov 7, 2021; 27(41): 7207-7209
Published online Nov 7, 2021. doi: 10.3748/wjg.v27.i41.7207
Published online Nov 7, 2021. doi: 10.3748/wjg.v27.i41.7207
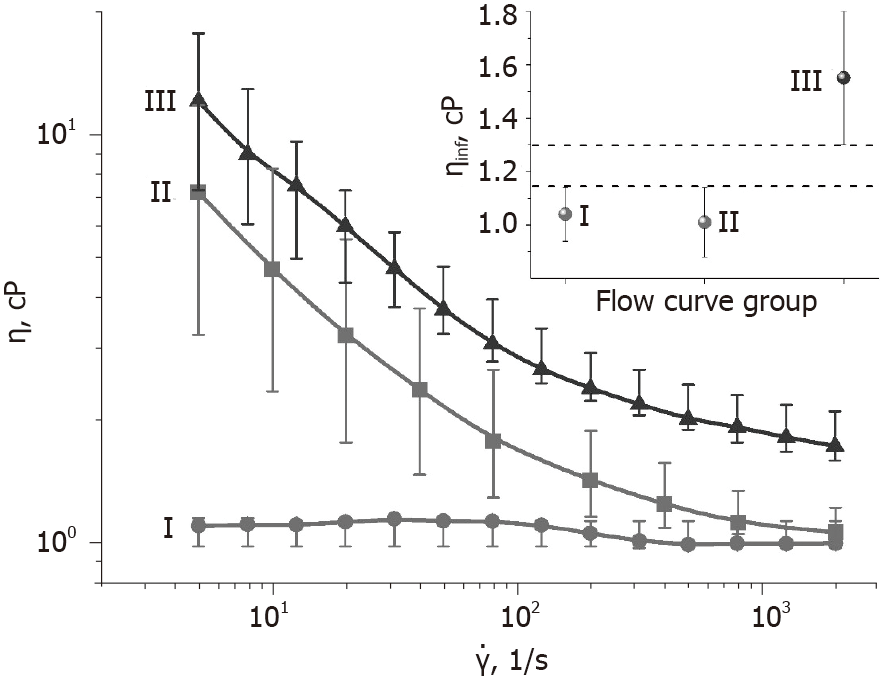
Figure 1 Representative types I, II and III flow curves.
The graph inset shows the values of infinite viscosity, ηc, depicting the difference between the minimal value of type III and the maximum value of types I and II.
- Citation: Khamaysi I, Zussman E. Pancreatic cyst dilemma: Between physical and biochemical markers. World J Gastroenterol 2021; 27(41): 7207-7209
- URL: https://www.wjgnet.com/1007-9327/full/v27/i41/7207.htm
- DOI: https://dx.doi.org/10.3748/wjg.v27.i41.7207


