Copyright
©The Author(s) 2021.
World J Gastroenterol. Jan 28, 2021; 27(4): 305-320
Published online Jan 28, 2021. doi: 10.3748/wjg.v27.i4.305
Published online Jan 28, 2021. doi: 10.3748/wjg.v27.i4.305
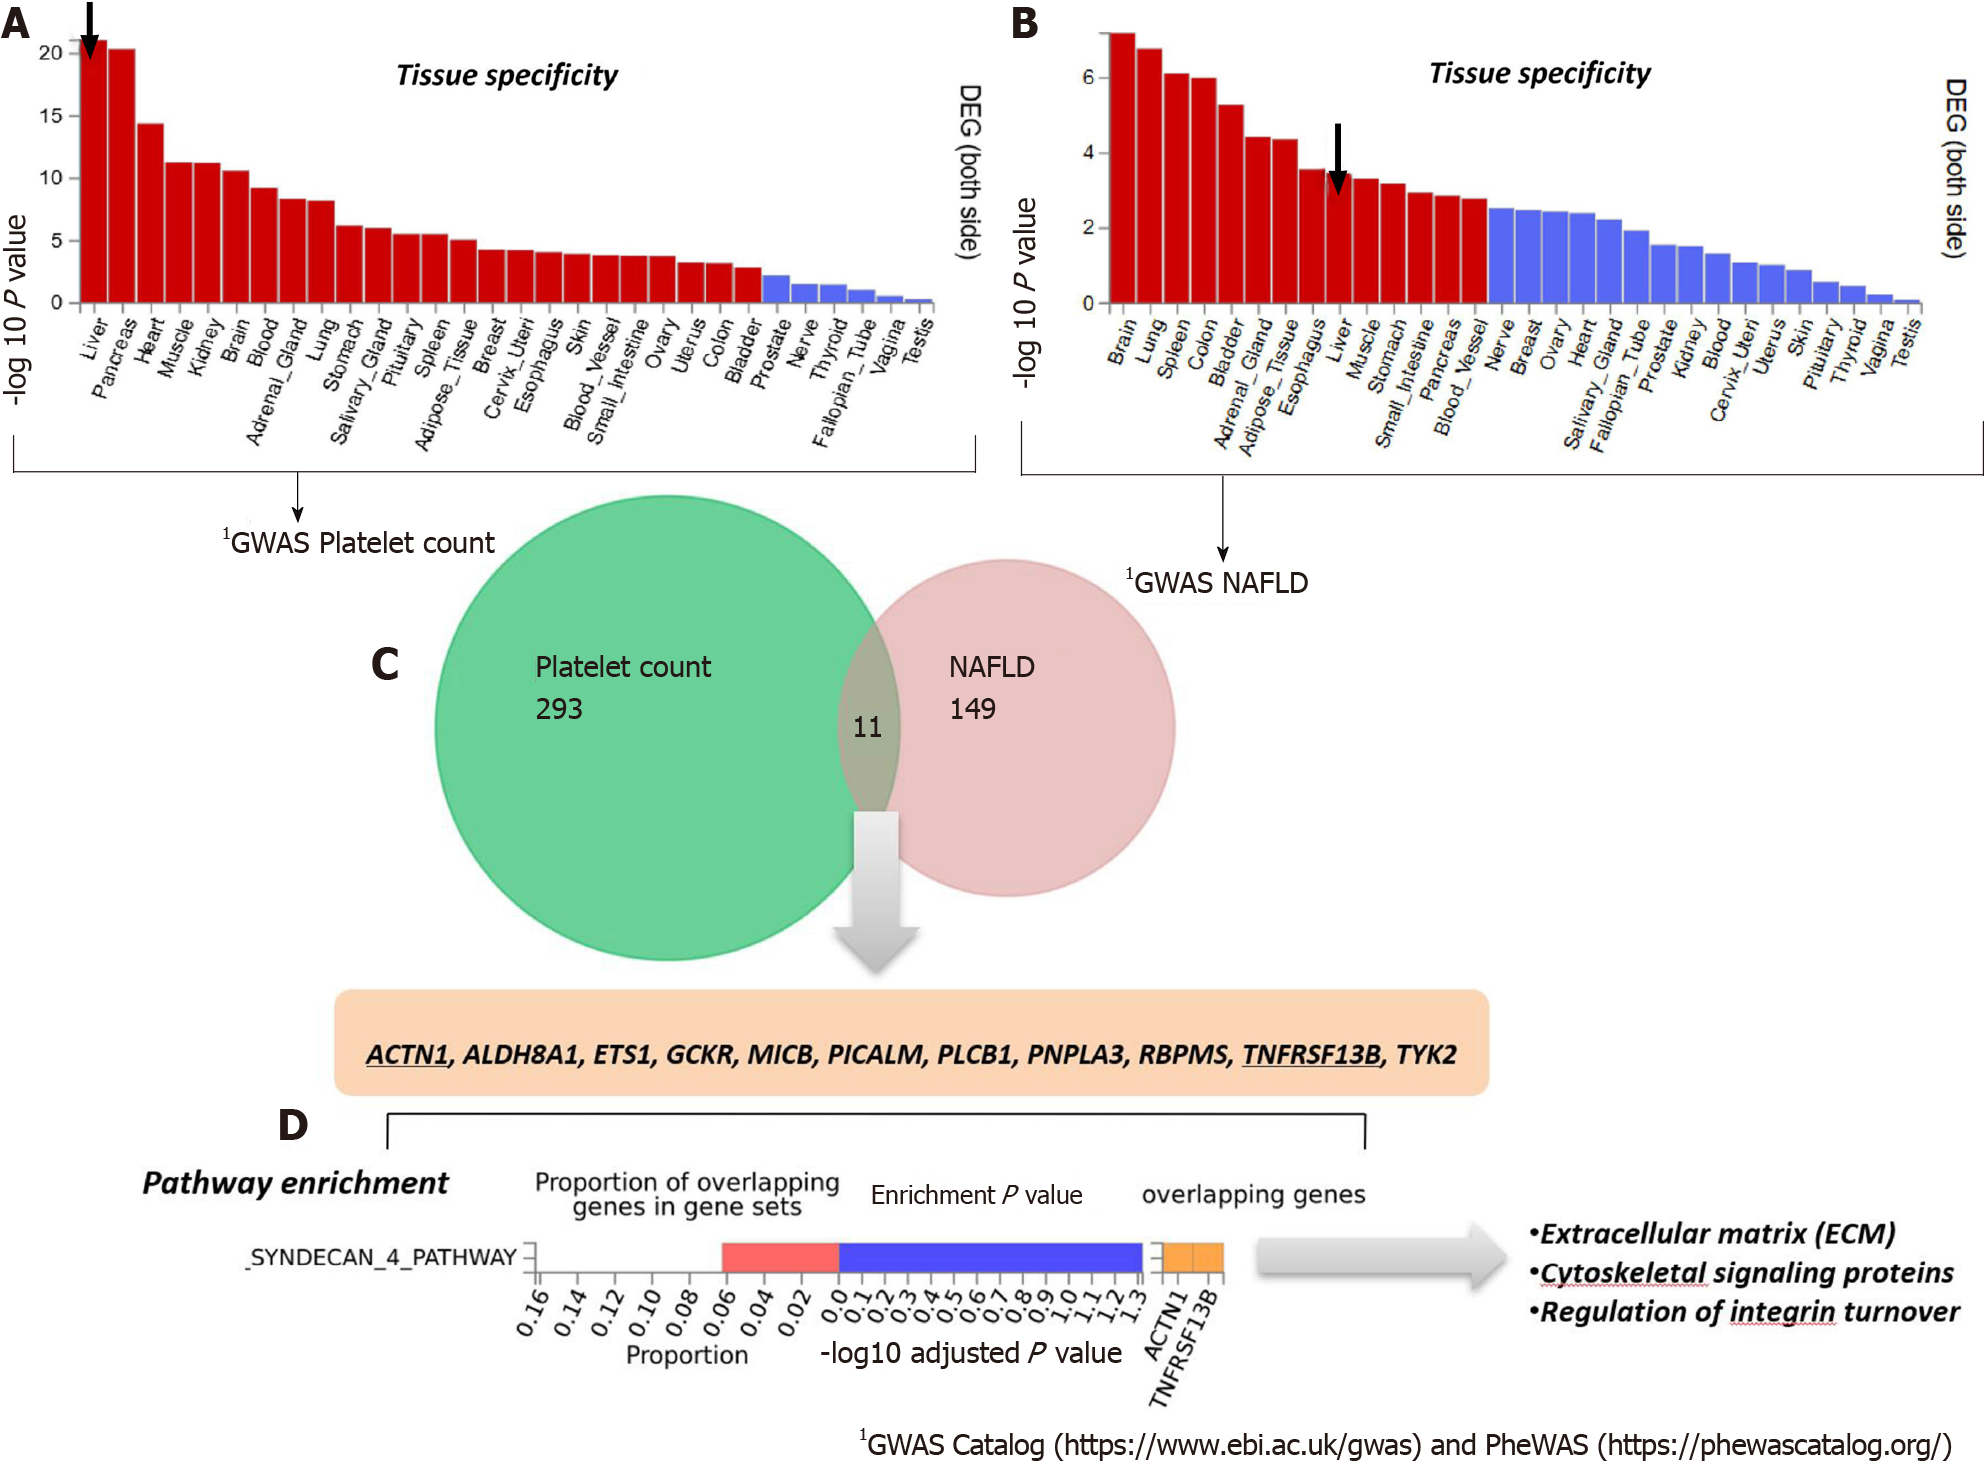
Figure 3 Genes that are shared between nonalcoholic fatty liver disease and platelet count.
A and B: Significantly enriched Differentially Expressed Gene (DEG) Sets (Pbon < 0.05) are highlighted in red (FUMA). DEG sets were pre-calculated by performing two-sided t-test for any one of the labels against all others. For this purpose, expression values were normalized (zero-mean) to obtain a log2 transformation of expression value (EPKM or TPM). Genes with P ≤ 0.05 after Bonferroni correction and absolute log fold change ≥ 0.58 were defined as differentially expressed genes in a given label compared to others. In addition to DEG, up-regulated DEG and down-regulated DEG were also pre-calculated by taking the sign of t-statistics into account. Input genes were tested against each of the DEG sets using the hypergeometric test. The background genes are genes that have average expression value > 1 in at least one of the labels and exist in the user-selected background genes. Significant enrichment at Bonferroni-corrected P ≤ 0.05 is colored in red. C: Venn diagram showing the number of genes that are common (overlapping areas) and dissimilar (non-overlapping areas) in nonalcoholic fatty liver disease (NAFLD) and platelet count gene lists. D: Pathway analysis using all Canonical Pathways (MsigDB c2) in the web-based FUMA platform available at http://fuma.ctglab.nl. Overlapping genes (underlined): ACTN1: Actinin Alpha 1; TNFRSF13B: TNF Receptor Superfamily Member 13B. The input lists of platelet count- and NAFLD-associated variants were generated by searching the Open Target platform, which contains data retrieved from GWAS Catalog (https://www.ebi.ac.uk/gwas) and phenome-wide association studies (https://phewascatalog.org/). The list of genes associated with platelet count contains 305 loci and that associated with NAFLD contains 149 loci, as shown in Supplementary Figures 1 and 2, respectively.
- Citation: Pirola CJ, Salatino A, Sookoian S. Pleiotropy within gene variants associated with nonalcoholic fatty liver disease and traits of the hematopoietic system. World J Gastroenterol 2021; 27(4): 305-320
- URL: https://www.wjgnet.com/1007-9327/full/v27/i4/305.htm
- DOI: https://dx.doi.org/10.3748/wjg.v27.i4.305


