Copyright
©The Author(s) 2021.
World J Gastroenterol. Oct 21, 2021; 27(39): 6615-6630
Published online Oct 21, 2021. doi: 10.3748/wjg.v27.i39.6615
Published online Oct 21, 2021. doi: 10.3748/wjg.v27.i39.6615
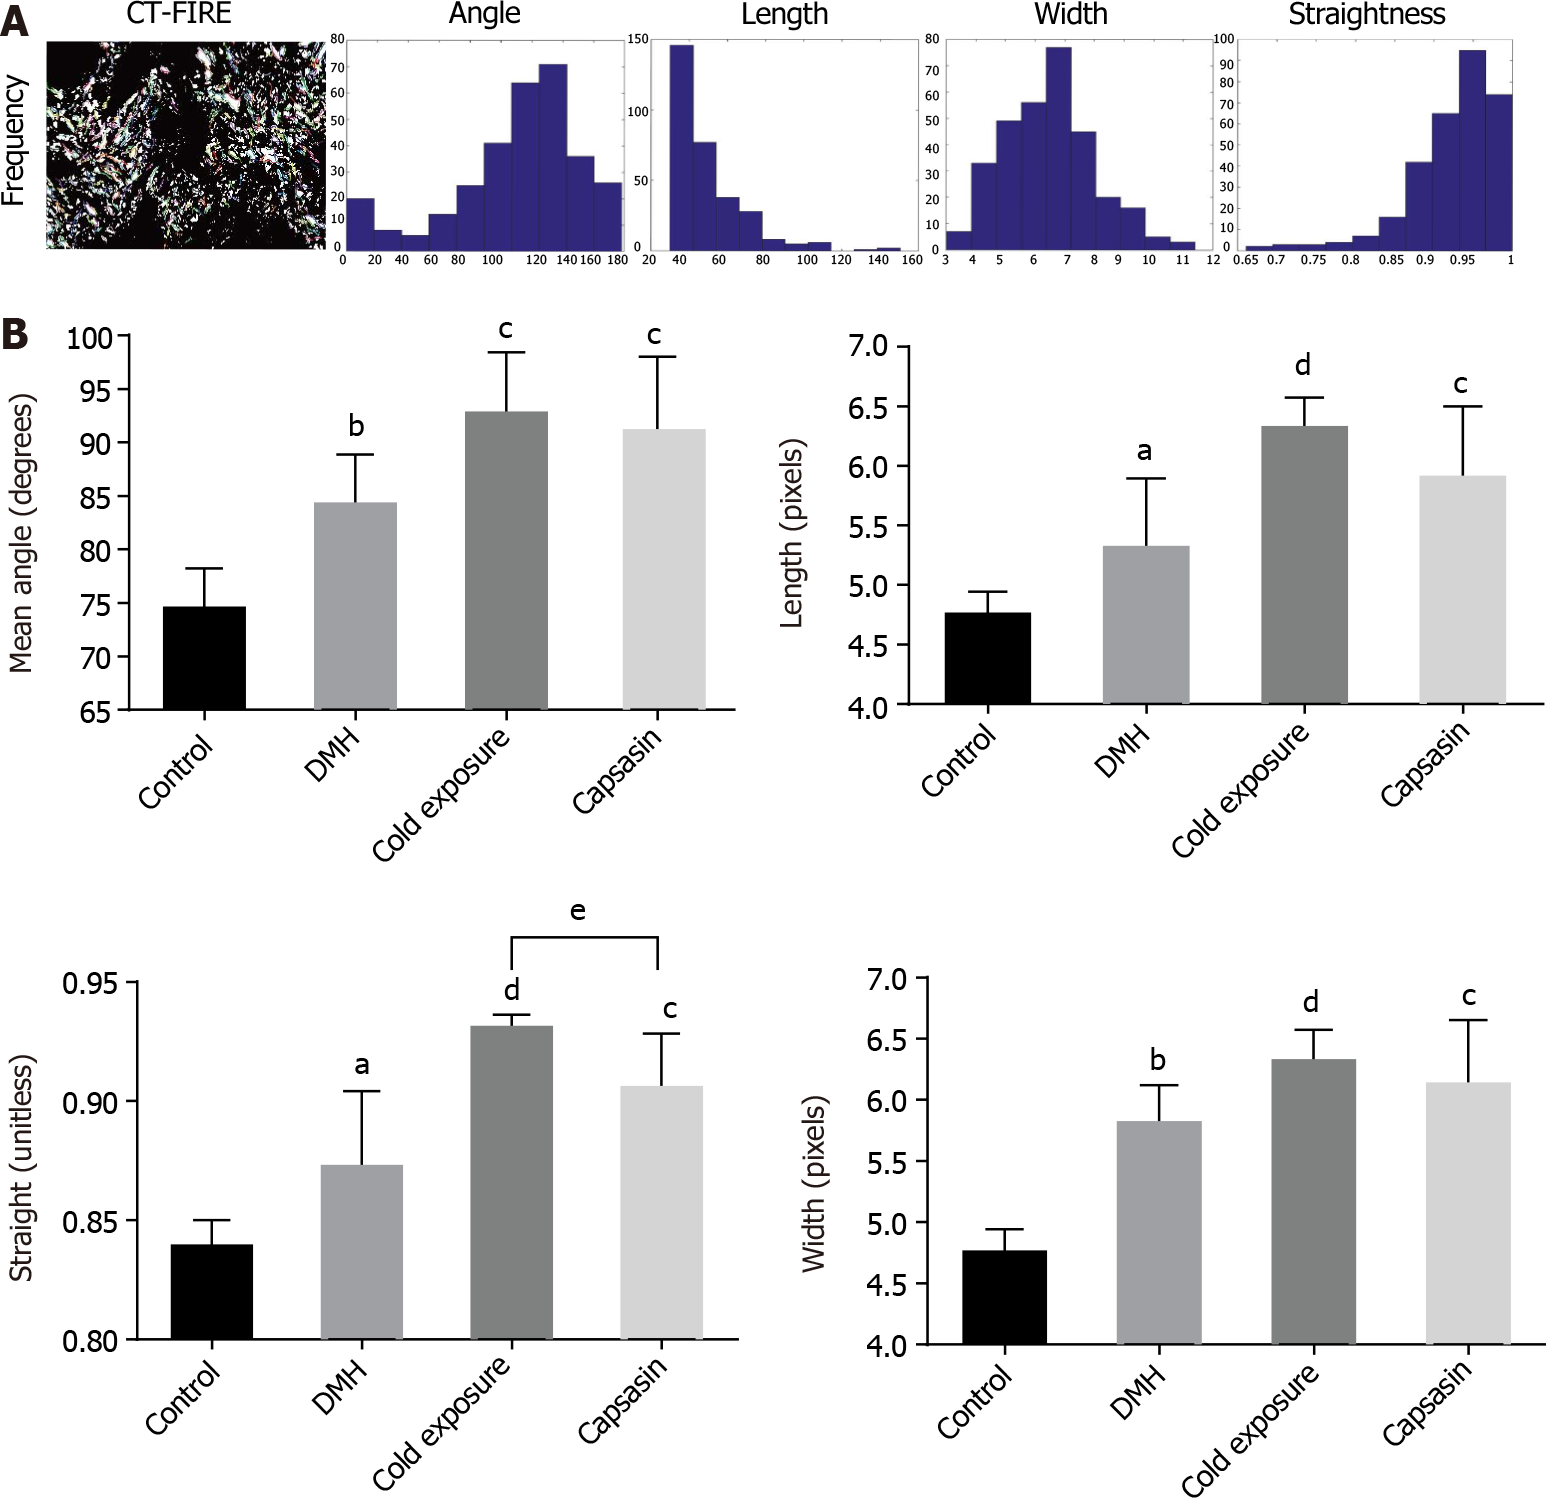
Figure 4 Collagen fibers were automatically extracted for analysis using open-source software CT-FIRE.
A: Histograms were generated to show the distribution of various parameters in each polarized light microscopy imaging; B: Quantitative analysis of collagen fibers from polarized light microscopy imaging in the colonic mucosa of different treatment groups. Data are mean ± SE of three images per tissues region. aP < 0.05, bP < 0.01, control compared with 1,2-dimethylhyrazine (DMH); cP < 0.05, dP < 0.01, DMH compared with cold exposure and capsaicin-treated group; eP < 0.05, Cold exposure compared with capsaicin-treated group.
- Citation: Qin JC, Yu WT, Li HX, Liang YQ, Nong FF, Wen B. Cold exposure and capsaicin promote 1,2-dimethylhyrazine-induced colon carcinogenesis in rats correlates with extracellular matrix remodeling. World J Gastroenterol 2021; 27(39): 6615-6630
- URL: https://www.wjgnet.com/1007-9327/full/v27/i39/6615.htm
- DOI: https://dx.doi.org/10.3748/wjg.v27.i39.6615


