Copyright
©The Author(s) 2021.
World J Gastroenterol. Sep 21, 2021; 27(35): 5978-5988
Published online Sep 21, 2021. doi: 10.3748/wjg.v27.i35.5978
Published online Sep 21, 2021. doi: 10.3748/wjg.v27.i35.5978
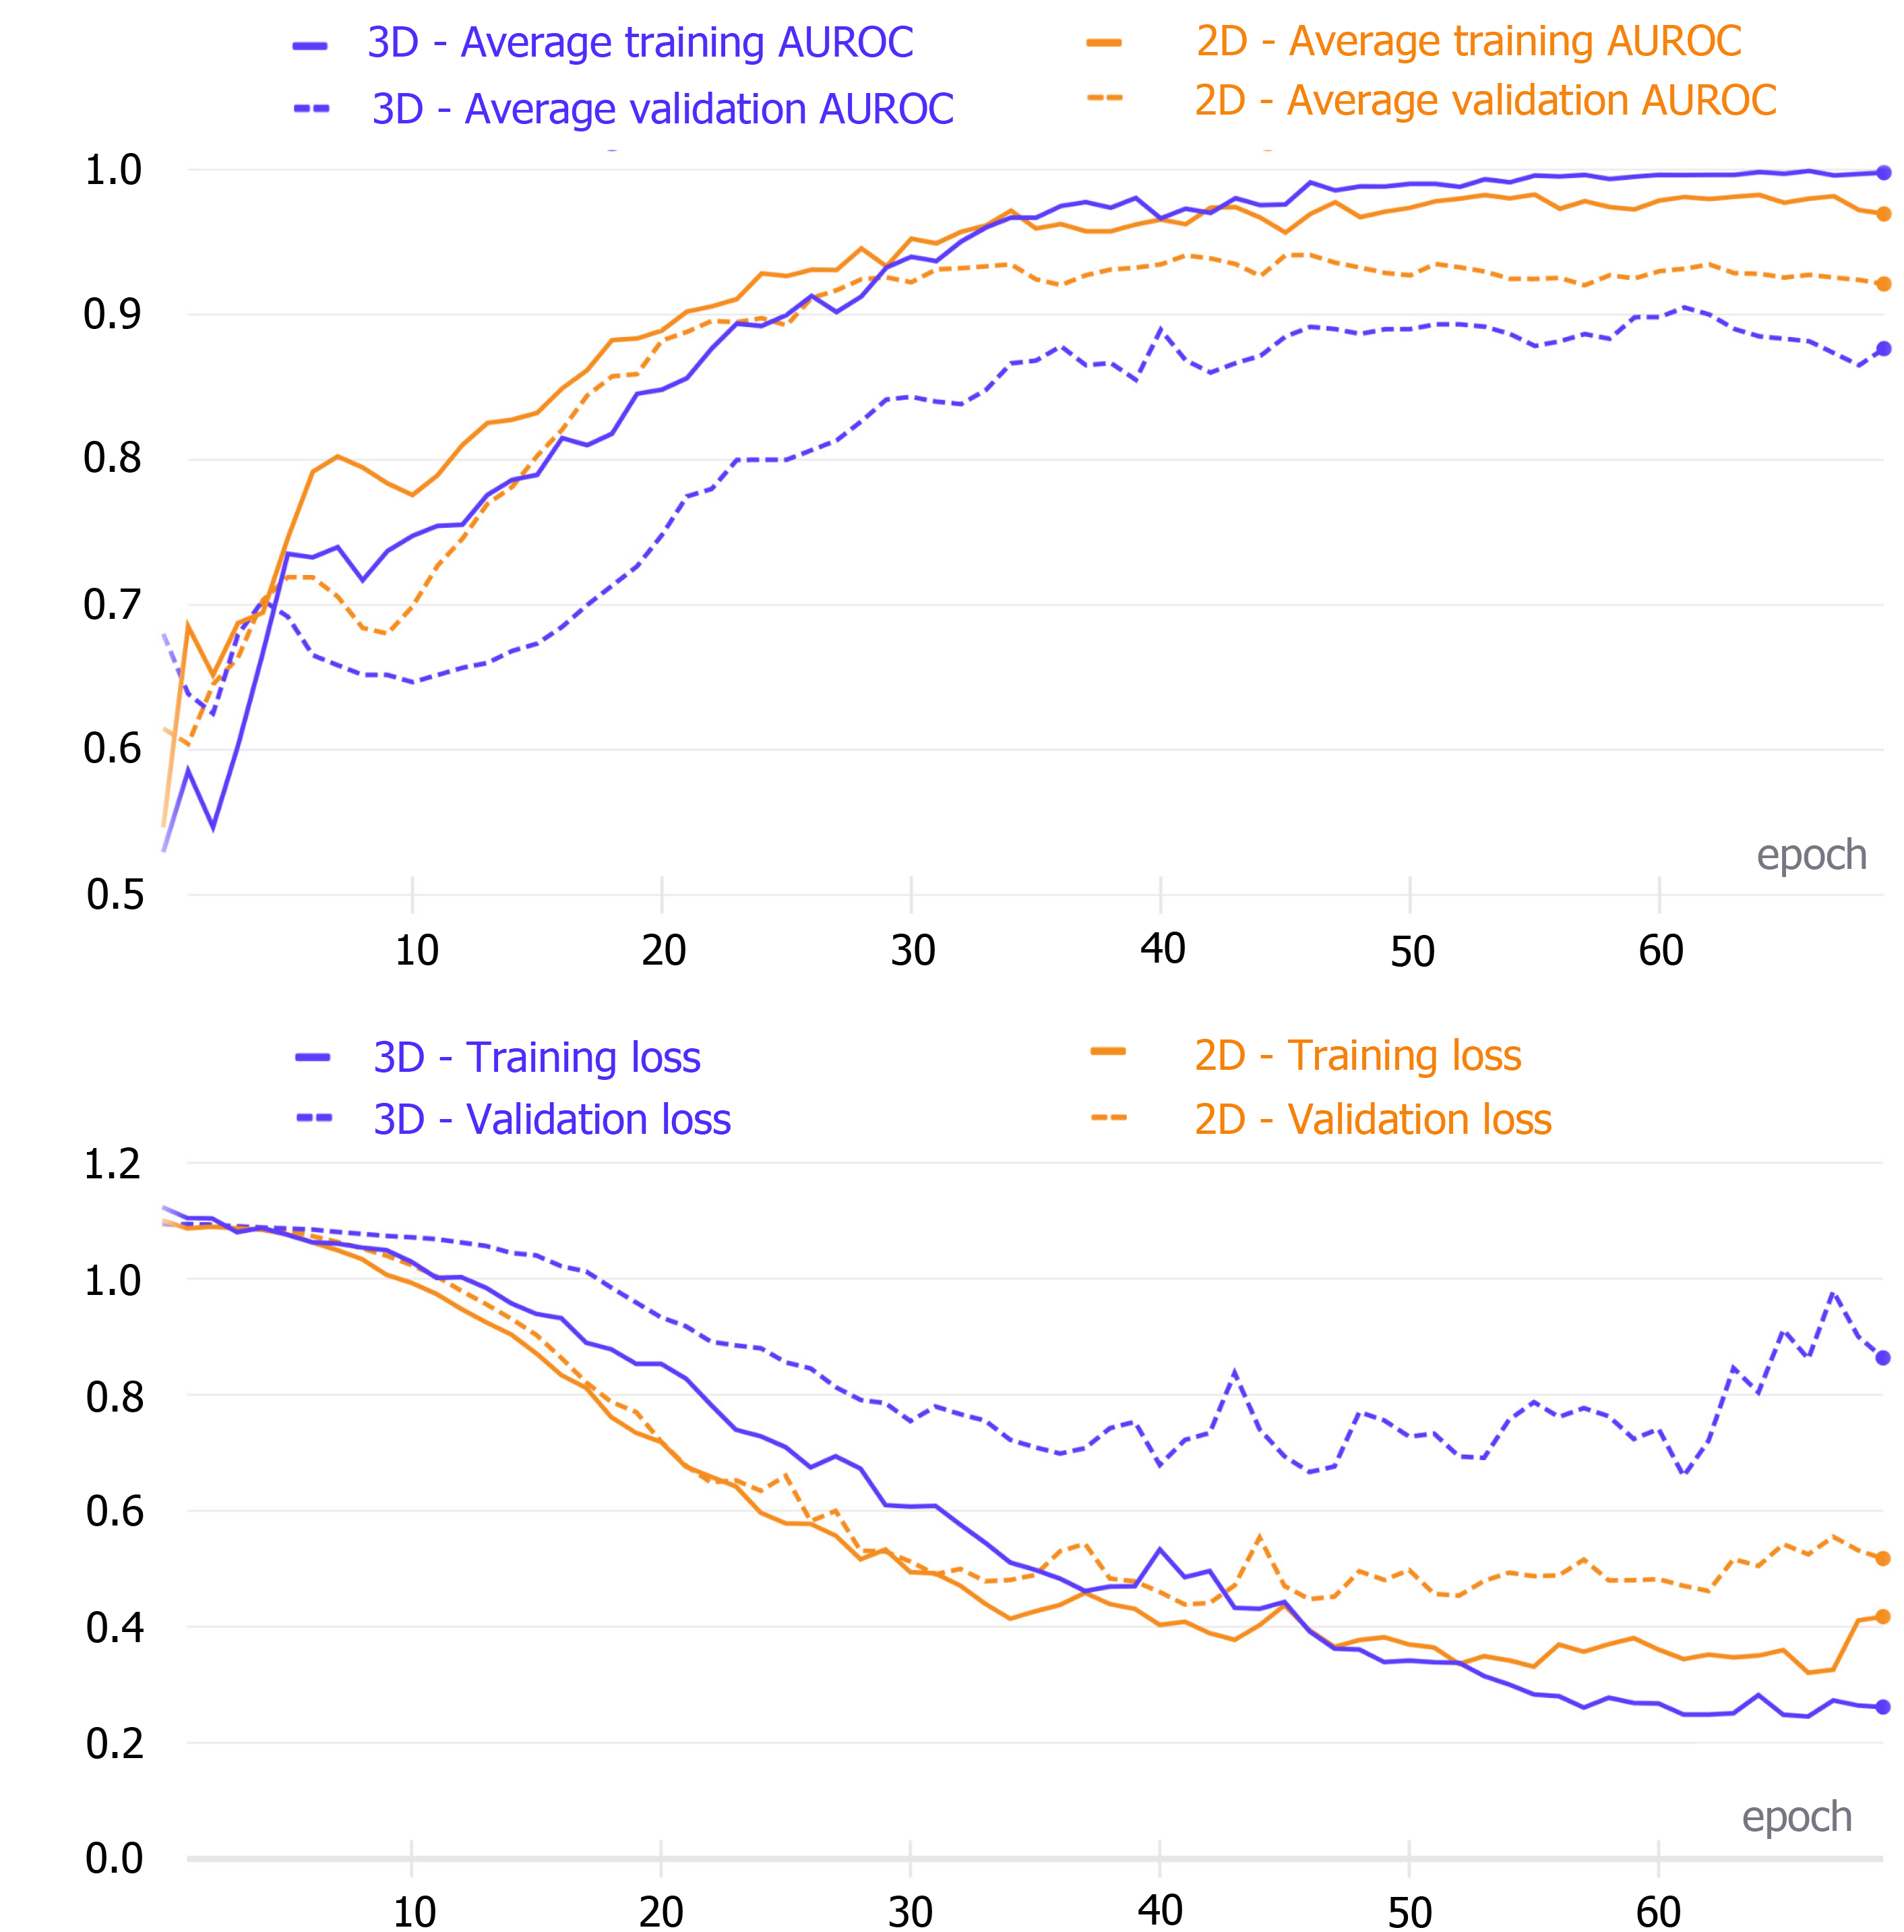
Figure 3 Comparison of the training evaluation metric curves and loss curves.
The upper figure shows the area under the receiver operating characteristic curve (AUROC) values after each training epoch of the two-dimensional (2D) and three-dimensional (3D) densely connected convolutional neural networks (DenseNets). The best average AUC was obtained after the 46th (2D network) and 62nd (3D network) epochs. The lower figure indicates the loss values for each training epoch of the two networks. 2D: Two-dimensional; 3D: Three-dimensional; AUROC: Area under the receiver operating characteristic curve.
- Citation: Stollmayer R, Budai BK, Tóth A, Kalina I, Hartmann E, Szoldán P, Bérczi V, Maurovich-Horvat P, Kaposi PN. Diagnosis of focal liver lesions with deep learning-based multi-channel analysis of hepatocyte-specific contrast-enhanced magnetic resonance imaging. World J Gastroenterol 2021; 27(35): 5978-5988
- URL: https://www.wjgnet.com/1007-9327/full/v27/i35/5978.htm
- DOI: https://dx.doi.org/10.3748/wjg.v27.i35.5978


