Copyright
©The Author(s) 2021.
World J Gastroenterol. Sep 7, 2021; 27(33): 5610-5621
Published online Sep 7, 2021. doi: 10.3748/wjg.v27.i33.5610
Published online Sep 7, 2021. doi: 10.3748/wjg.v27.i33.5610
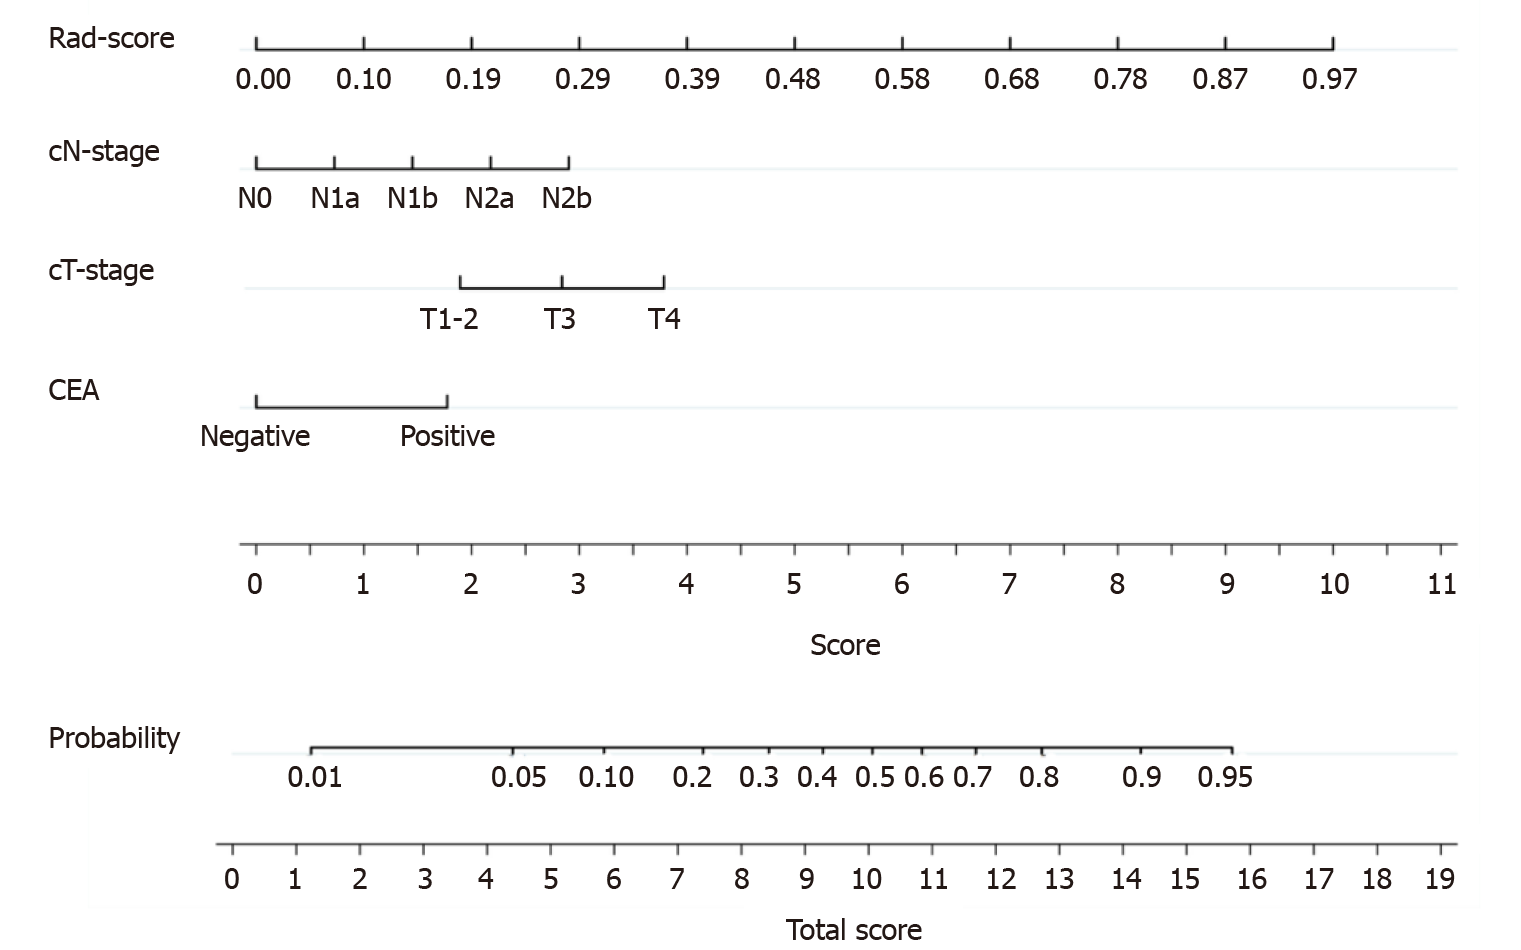
Figure 3 The nomogram was developed in the training cohort.
Sum the points of variables in the “score” axis to get the total points. The risk of perineural invasion is the corresponding value on the “probability” axis. CEA: Carcinoembryonic antigen; cT: Computed tomography-reported T stage; cN: Computed tomography-reported N stage.
- Citation: Li M, Jin YM, Zhang YC, Zhao YL, Huang CC, Liu SM, Song B. Radiomics for predicting perineural invasion status in rectal cancer. World J Gastroenterol 2021; 27(33): 5610-5621
- URL: https://www.wjgnet.com/1007-9327/full/v27/i33/5610.htm
- DOI: https://dx.doi.org/10.3748/wjg.v27.i33.5610


