Copyright
©The Author(s) 2021.
World J Gastroenterol. Sep 7, 2021; 27(33): 5575-5594
Published online Sep 7, 2021. doi: 10.3748/wjg.v27.i33.5575
Published online Sep 7, 2021. doi: 10.3748/wjg.v27.i33.5575
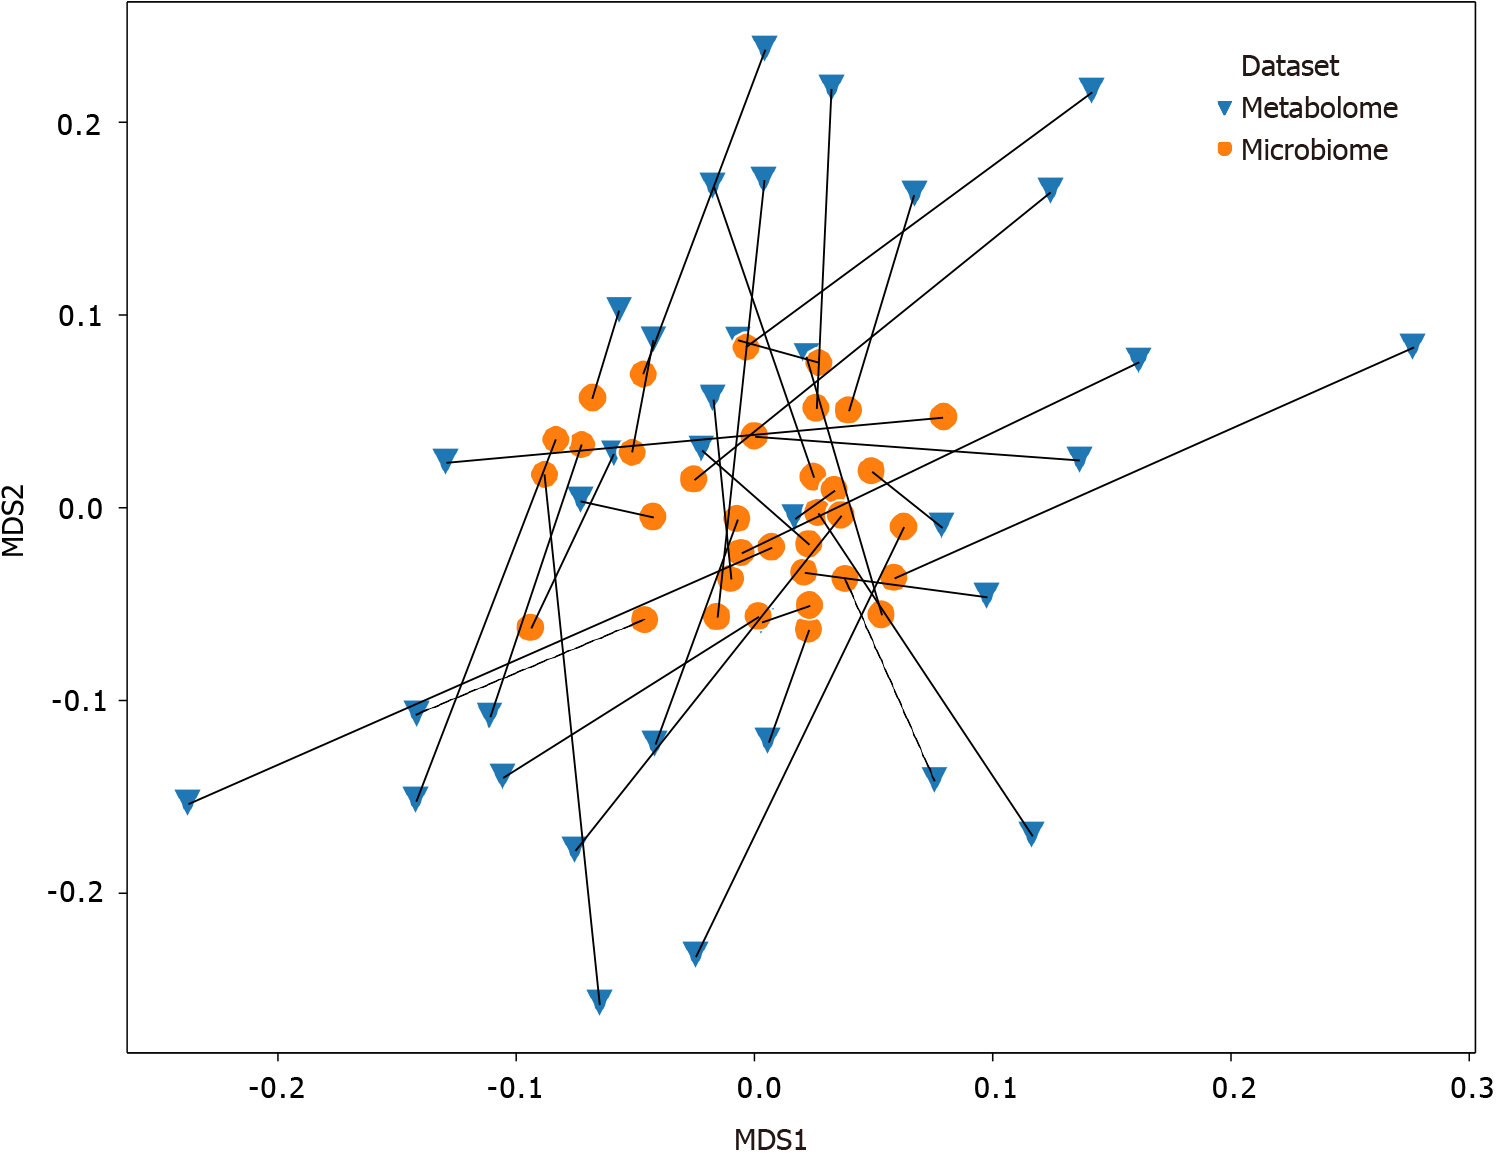
Figure 5 Procrustes-transformed Bray-Curtis multi-dimensional scaling of microbiome and metabolome.
Connections between the fecal microbiome and fecal metabolome Bray-Curtis multi-dimensional scaling plots. The microbiome data shown here have been transformed by the Procrustes analysis to minimize disparity between the two datasets, and lines have been drawn to indicate microbiome and metabolome from the same participants. Orange dots represent the microbiomes, whereas blue triangles represent the metabolomes. The Procrustes randomization test showed a significant relationship between the datasets (m2 = 0.86, P = 0.017). MDS: Multi-dimensional scaling.
- Citation: White B, Sterrett JD, Grigoryan Z, Lally L, Heinze JD, Alikhan H, Lowry CA, Perez LJ, DeSipio J, Phadtare S. Characterization of gut microbiome and metabolome in Helicobacter pylori patients in an underprivileged community in the United States. World J Gastroenterol 2021; 27(33): 5575-5594
- URL: https://www.wjgnet.com/1007-9327/full/v27/i33/5575.htm
- DOI: https://dx.doi.org/10.3748/wjg.v27.i33.5575


