Copyright
©The Author(s) 2021.
World J Gastroenterol. Aug 7, 2021; 27(29): 4913-4928
Published online Aug 7, 2021. doi: 10.3748/wjg.v27.i29.4913
Published online Aug 7, 2021. doi: 10.3748/wjg.v27.i29.4913
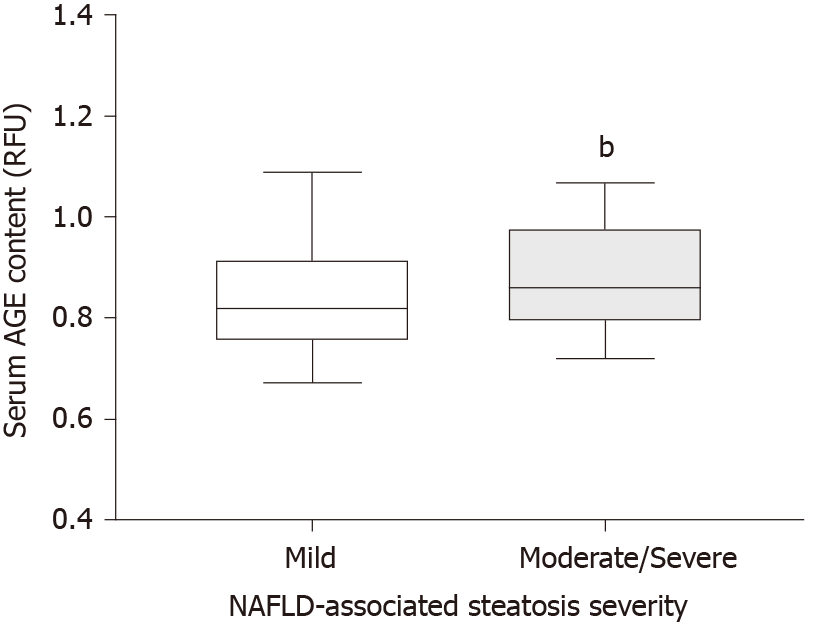
Figure 2 Boxplot showing the distribution of advanced glycation end product values in serum in the group of participants with mild steatosis and the group of participants with moderate/severe pooled steatosis.
Data are shown as median ± inter-quartile range. bP< 0.001. AGE: Advanced glycation end product; RFU: Relative fluorescent units.
- Citation: Pereira ENGDS, Paula DP, Araujo BP, Fonseca MJMD, Diniz MFHS, Daliry A, Griep RH. Advanced glycation end product: A potential biomarker for risk stratification of non-alcoholic fatty liver disease in ELSA-Brasil study. World J Gastroenterol 2021; 27(29): 4913-4928
- URL: https://www.wjgnet.com/1007-9327/full/v27/i29/4913.htm
- DOI: https://dx.doi.org/10.3748/wjg.v27.i29.4913


