Copyright
©The Author(s) 2021.
World J Gastroenterol. Jul 21, 2021; 27(27): 4395-4412
Published online Jul 21, 2021. doi: 10.3748/wjg.v27.i27.4395
Published online Jul 21, 2021. doi: 10.3748/wjg.v27.i27.4395
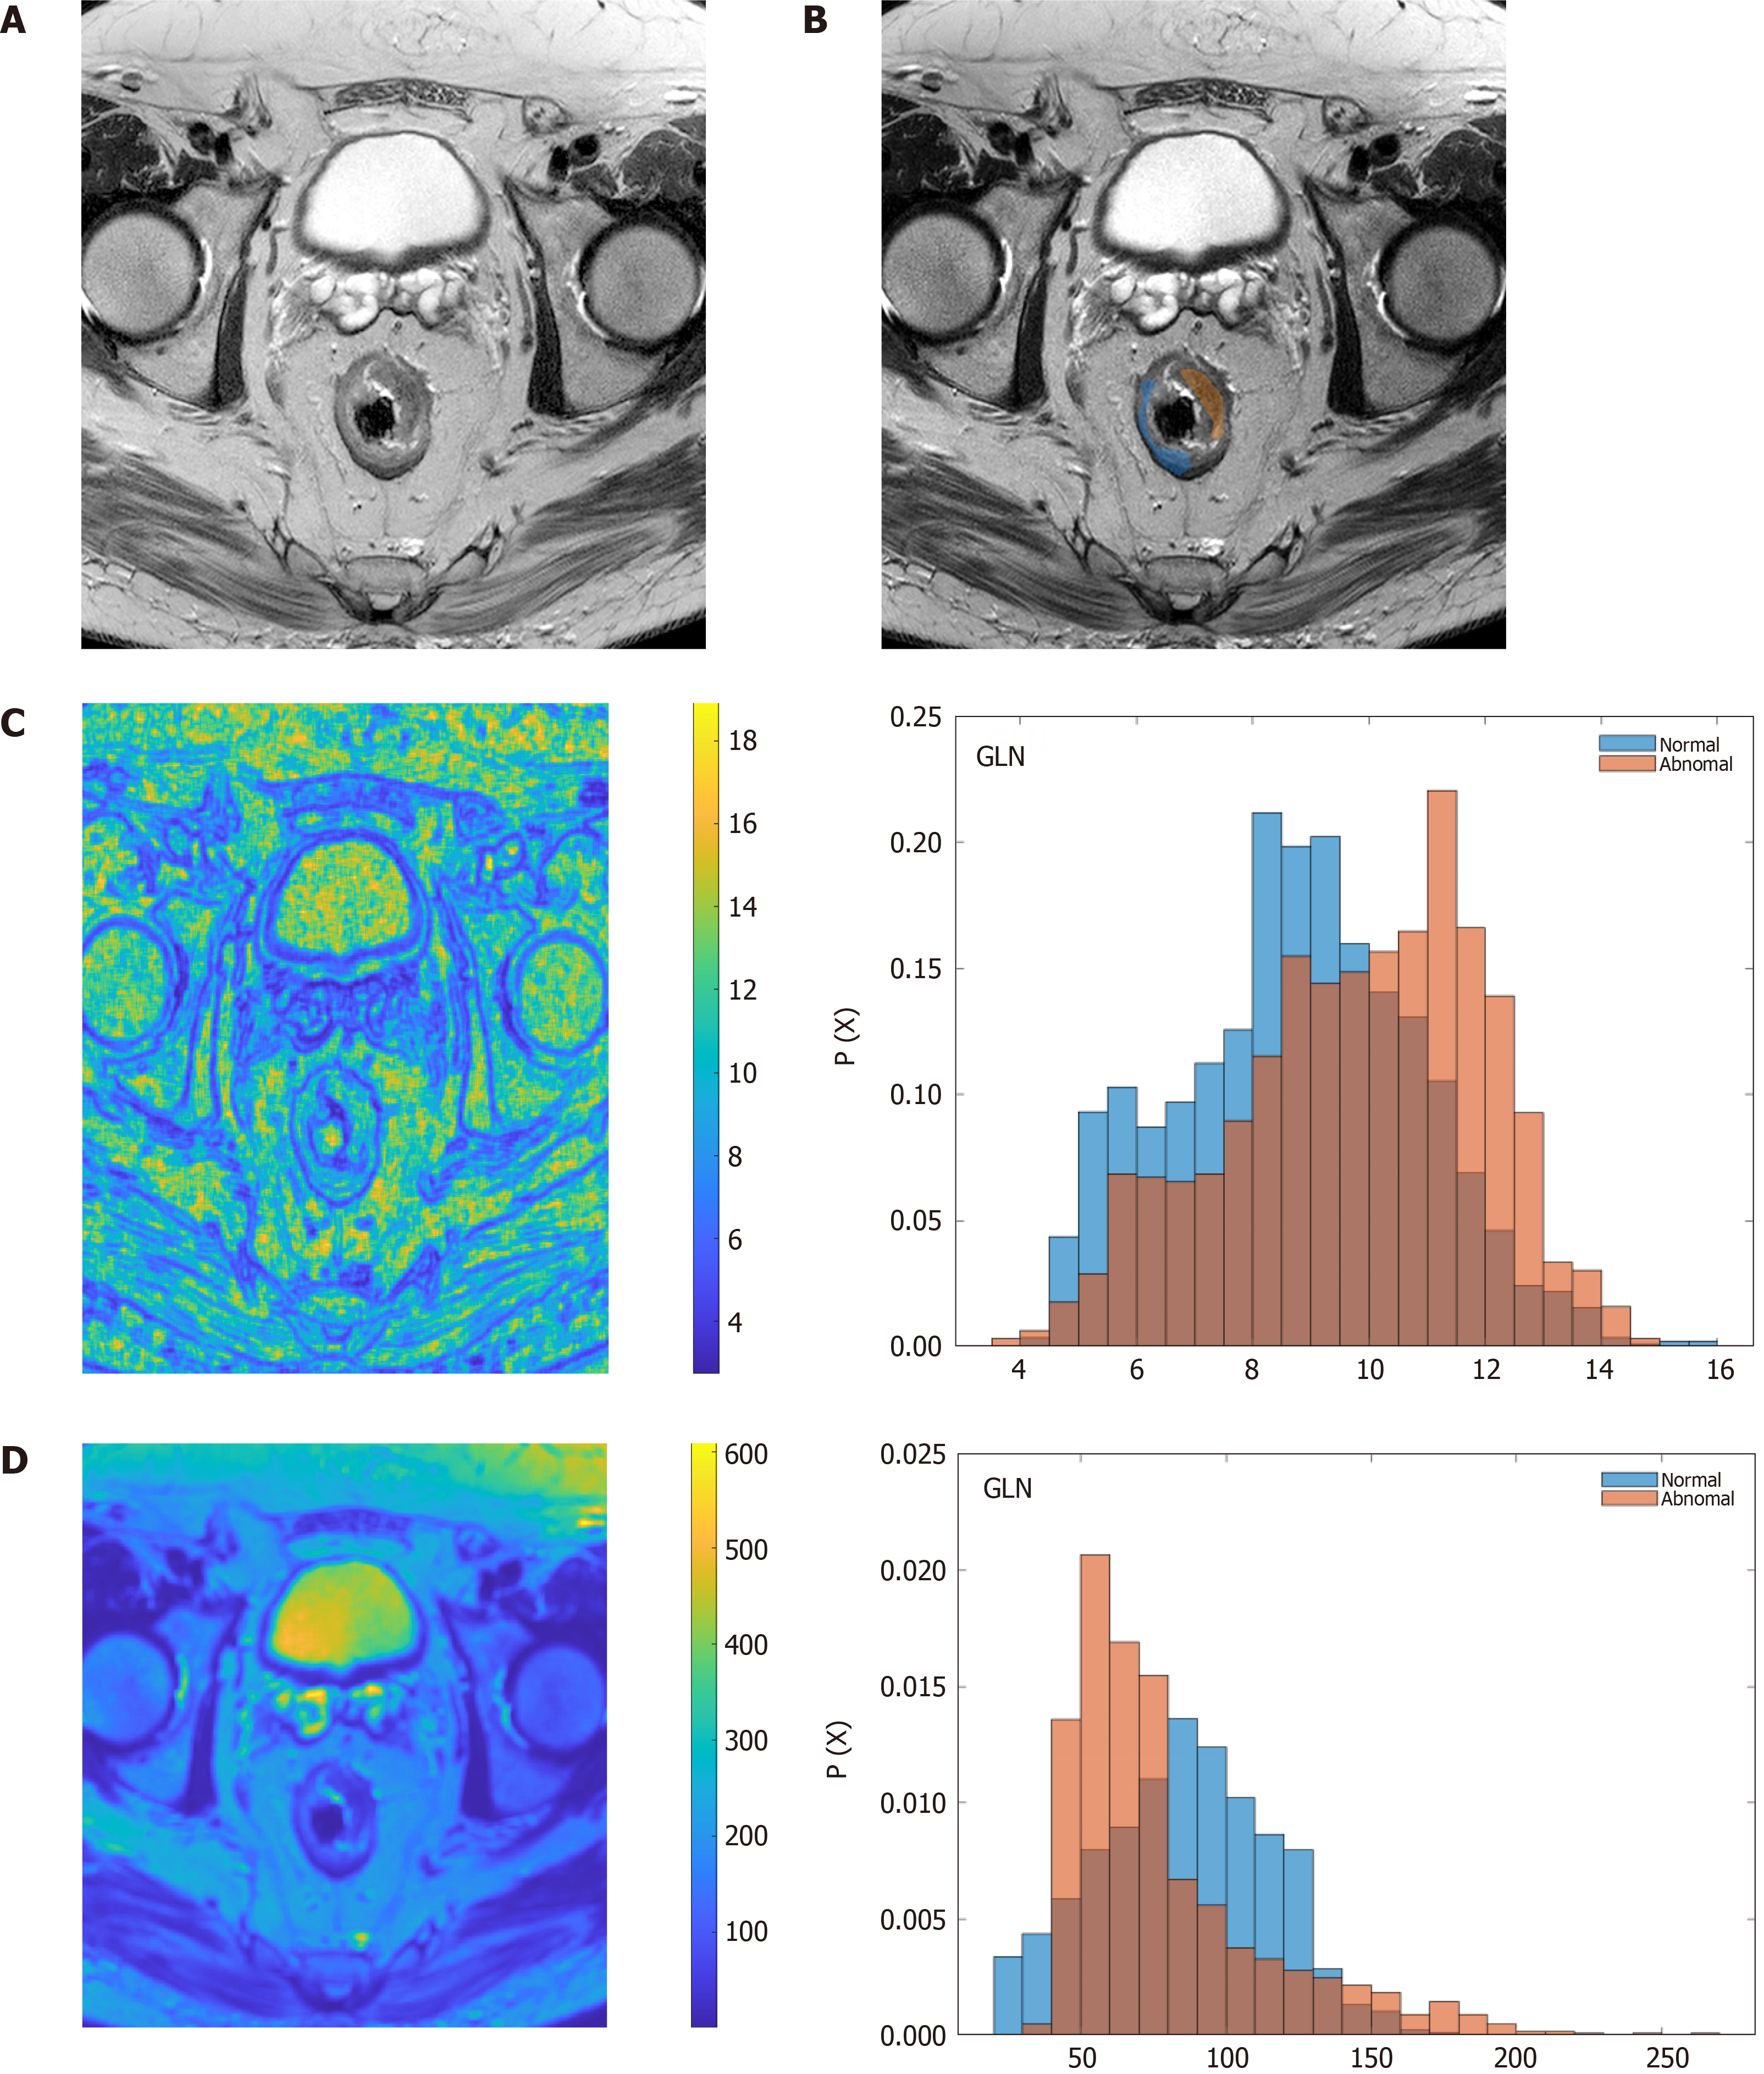
Figure 4 Texture analysis of rectal adenocarcinoma.
A: Original, axial T2-weighted image; B: Region of interest delineation of rectal tumor mass (orange) and normal tissue (blue); C and D: Parametric images and histograms of two different texture descriptors, showing differences between normal (blue) and tumor (brown) regions; C: Grey-level nonuniformity; D: High gray-level run emphasis. GLN: Grey-level nonuniformity; HGRE: High gray-level run emphasis.
- Citation: Berbís MA, Aneiros-Fernández J, Mendoza Olivares FJ, Nava E, Luna A. Role of artificial intelligence in multidisciplinary imaging diagnosis of gastrointestinal diseases. World J Gastroenterol 2021; 27(27): 4395-4412
- URL: https://www.wjgnet.com/1007-9327/full/v27/i27/4395.htm
- DOI: https://dx.doi.org/10.3748/wjg.v27.i27.4395


