Copyright
©The Author(s) 2021.
World J Gastroenterol. Jun 28, 2021; 27(24): 3609-3629
Published online Jun 28, 2021. doi: 10.3748/wjg.v27.i24.3609
Published online Jun 28, 2021. doi: 10.3748/wjg.v27.i24.3609
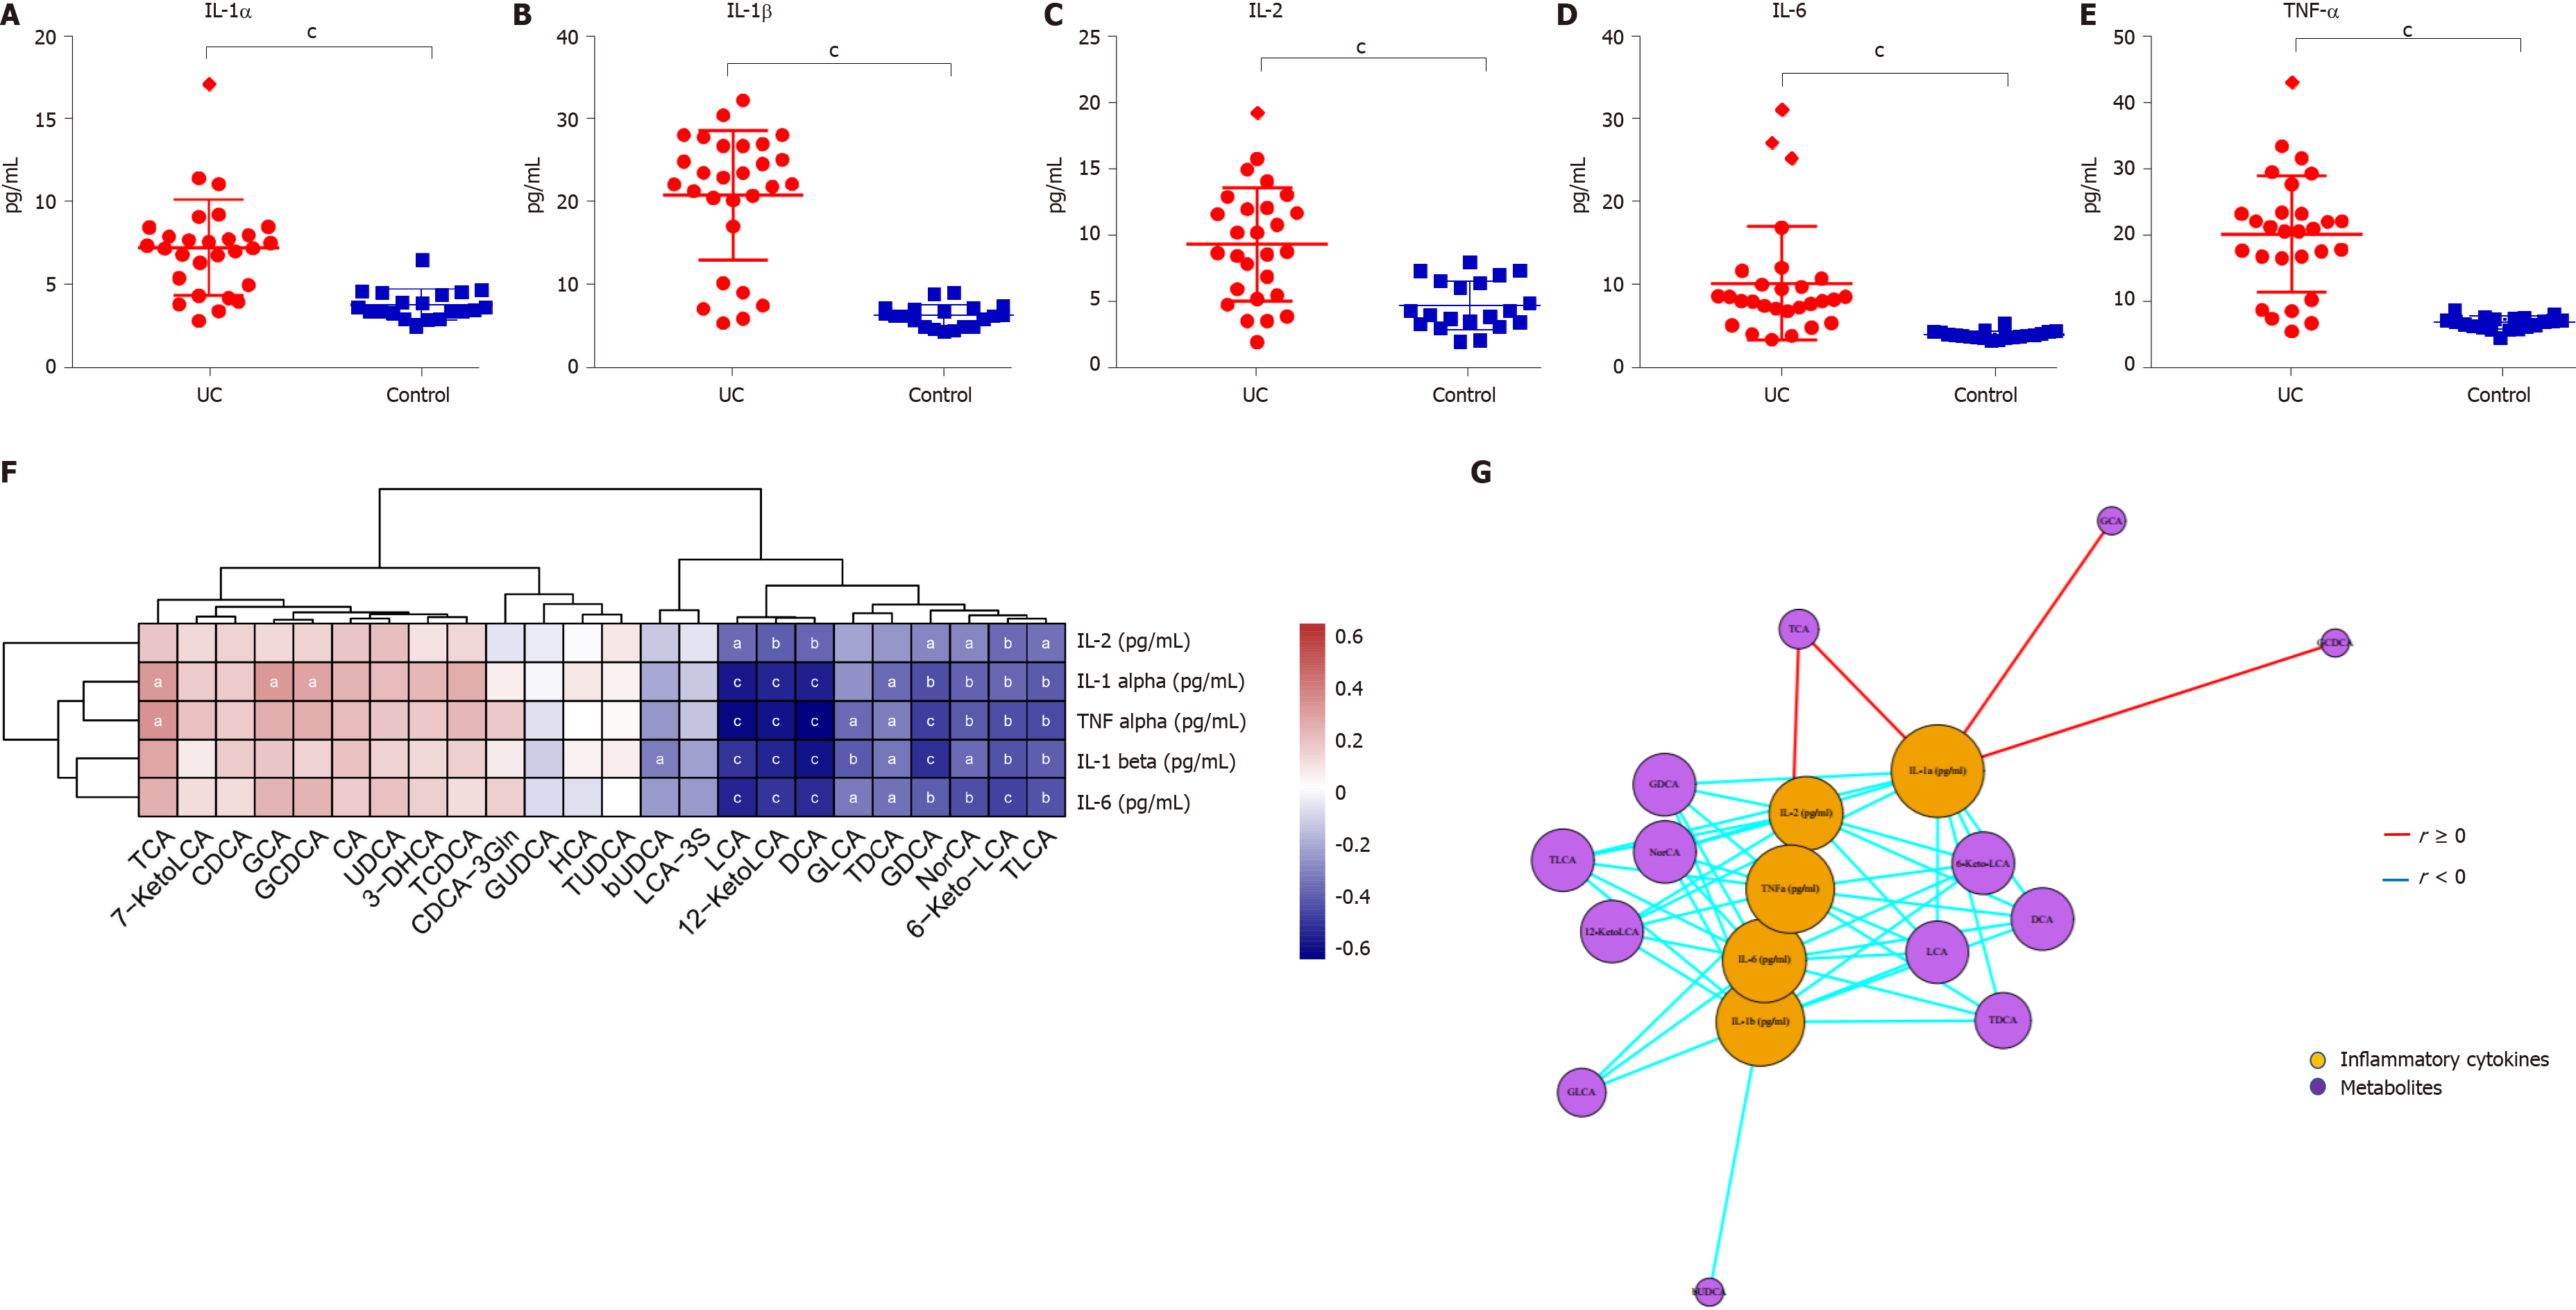
Figure 6 Serum inflammatory cytokine levels and correlations between fecal bile acids and serum inflammatory cytokines in all subjects.
A-E: The levels of IL-1α, IL-1β, TNF-α, IL-2, and IL-6 were significantly higher in UC patients (P < 0.0001); F: A heatmap of correlative assessments was made of the fecal bile acids and serum inflammatory cytokines ( aP < 0.05, bP < 0.01, cP < 0.001); G: A network diagram of correlative assessments was made on the fecal bile acid metabolites and serum inflammatory cytokines (purple nodes represent bile acid metabolites and orange nodes represent inflammatory cytokines; red lines represent positive correlations and blue lines represent negative correlations). aP < 0.05, bP < 0.01, cP < 0.001. LCA: Lithocholic acid; DCA: Deoxycholic acid; GDCA: Glyco-deoxycholic acid; GLCA: Glyco-lithocholic acid; TLCA: Tauro-lithocholate; TDCA: Tauro-deoxycholic acid; UDCA: Ursodeoxycholic acid; TUDCA: Tauro-ursodeoxycholic acid; GUDCA: Glyco-ursodeoxycholic acid; TCA: Tauro-cholic acid; CA: Cholic acid; TCDCA: Tauro-chenodeoxycholic acid; GCDCA: Glyco-chenodeoxycholic acid; CDCA: Chenodeoxycholic acid; GCA: Glyco-cholic acid.
- Citation: Yang ZH, Liu F, Zhu XR, Suo FY, Jia ZJ, Yao SK. Altered profiles of fecal bile acids correlate with gut microbiota and inflammatory responses in patients with ulcerative colitis. World J Gastroenterol 2021; 27(24): 3609-3629
- URL: https://www.wjgnet.com/1007-9327/full/v27/i24/3609.htm
- DOI: https://dx.doi.org/10.3748/wjg.v27.i24.3609


