Copyright
©The Author(s) 2021.
World J Gastroenterol. Jun 7, 2021; 27(21): 2871-2894
Published online Jun 7, 2021. doi: 10.3748/wjg.v27.i21.2871
Published online Jun 7, 2021. doi: 10.3748/wjg.v27.i21.2871
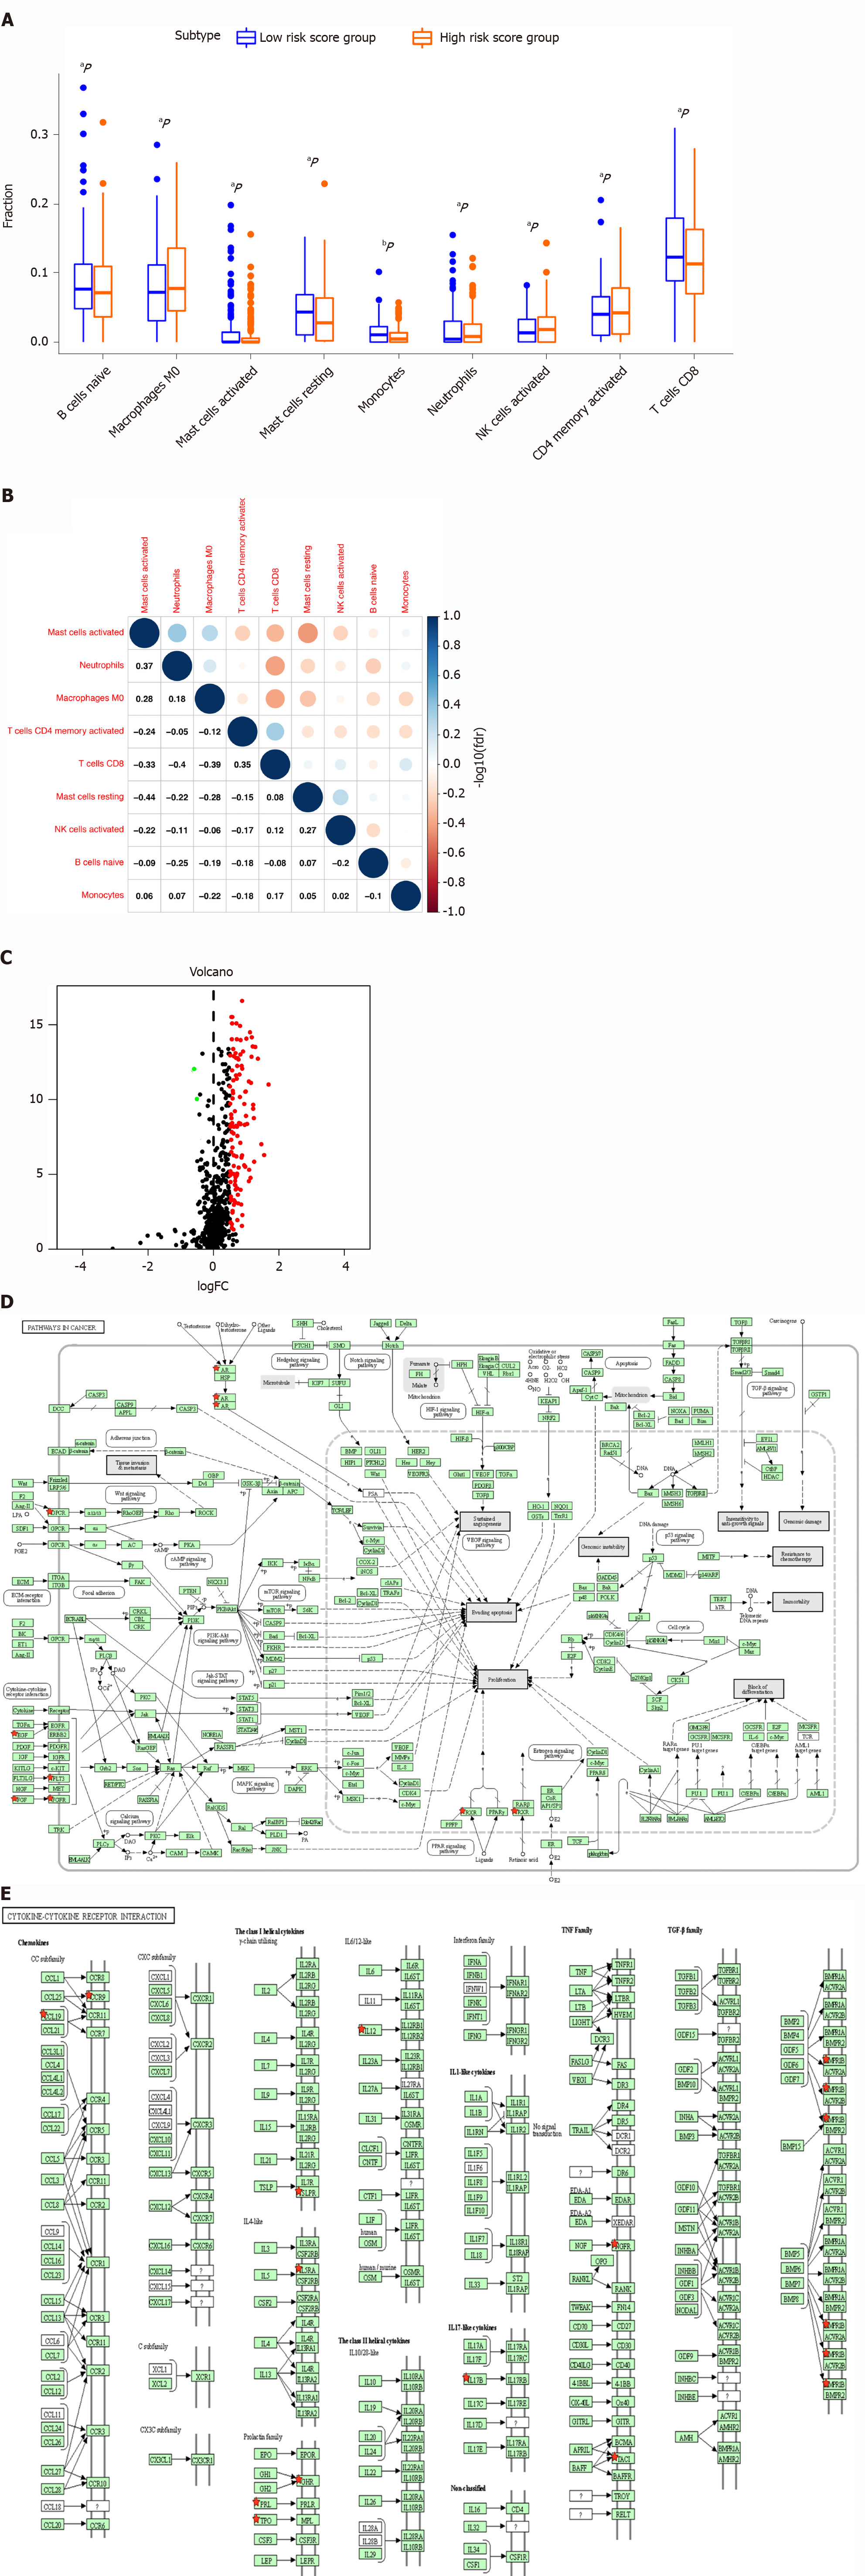
Figure 7 Difference in distribution of immune cells, expressed immune-related genes, and immune-related pathways between high- and low-risk score groups.
A: Boxplot shows the differences in the ratio of nine immune cells between the high- and low-risk-score groups in stomach adenocarcinoma (STAD); B: The correlation between those nine immune cells in STAD; C: Volcano plot of differentially expressed immune-related genes (DEIRGs) in STAD between the high- and low-risk-score groups. Upregulated DEIRGs are indicated in red points and downregulated DEIRGs in green points; D: The pathways in cancer was significantly enriched among DEIRGs in STAD (P < 0.05); E: The cytokine and cytokine receptor interaction pathway was significantly enriched among DEIRGs in STAD (P < 0.05). aP < 0.05, and bP < 0.01.
- Citation: Ye ZS, Zheng M, Liu QY, Zeng Y, Wei SH, Wang Y, Lin ZT, Shu C, Zheng QH, Chen LC. Survival-associated alternative splicing events interact with the immune microenvironment in stomach adenocarcinoma. World J Gastroenterol 2021; 27(21): 2871-2894
- URL: https://www.wjgnet.com/1007-9327/full/v27/i21/2871.htm
- DOI: https://dx.doi.org/10.3748/wjg.v27.i21.2871


