Copyright
©The Author(s) 2021.
World J Gastroenterol. Jun 7, 2021; 27(21): 2850-2870
Published online Jun 7, 2021. doi: 10.3748/wjg.v27.i21.2850
Published online Jun 7, 2021. doi: 10.3748/wjg.v27.i21.2850
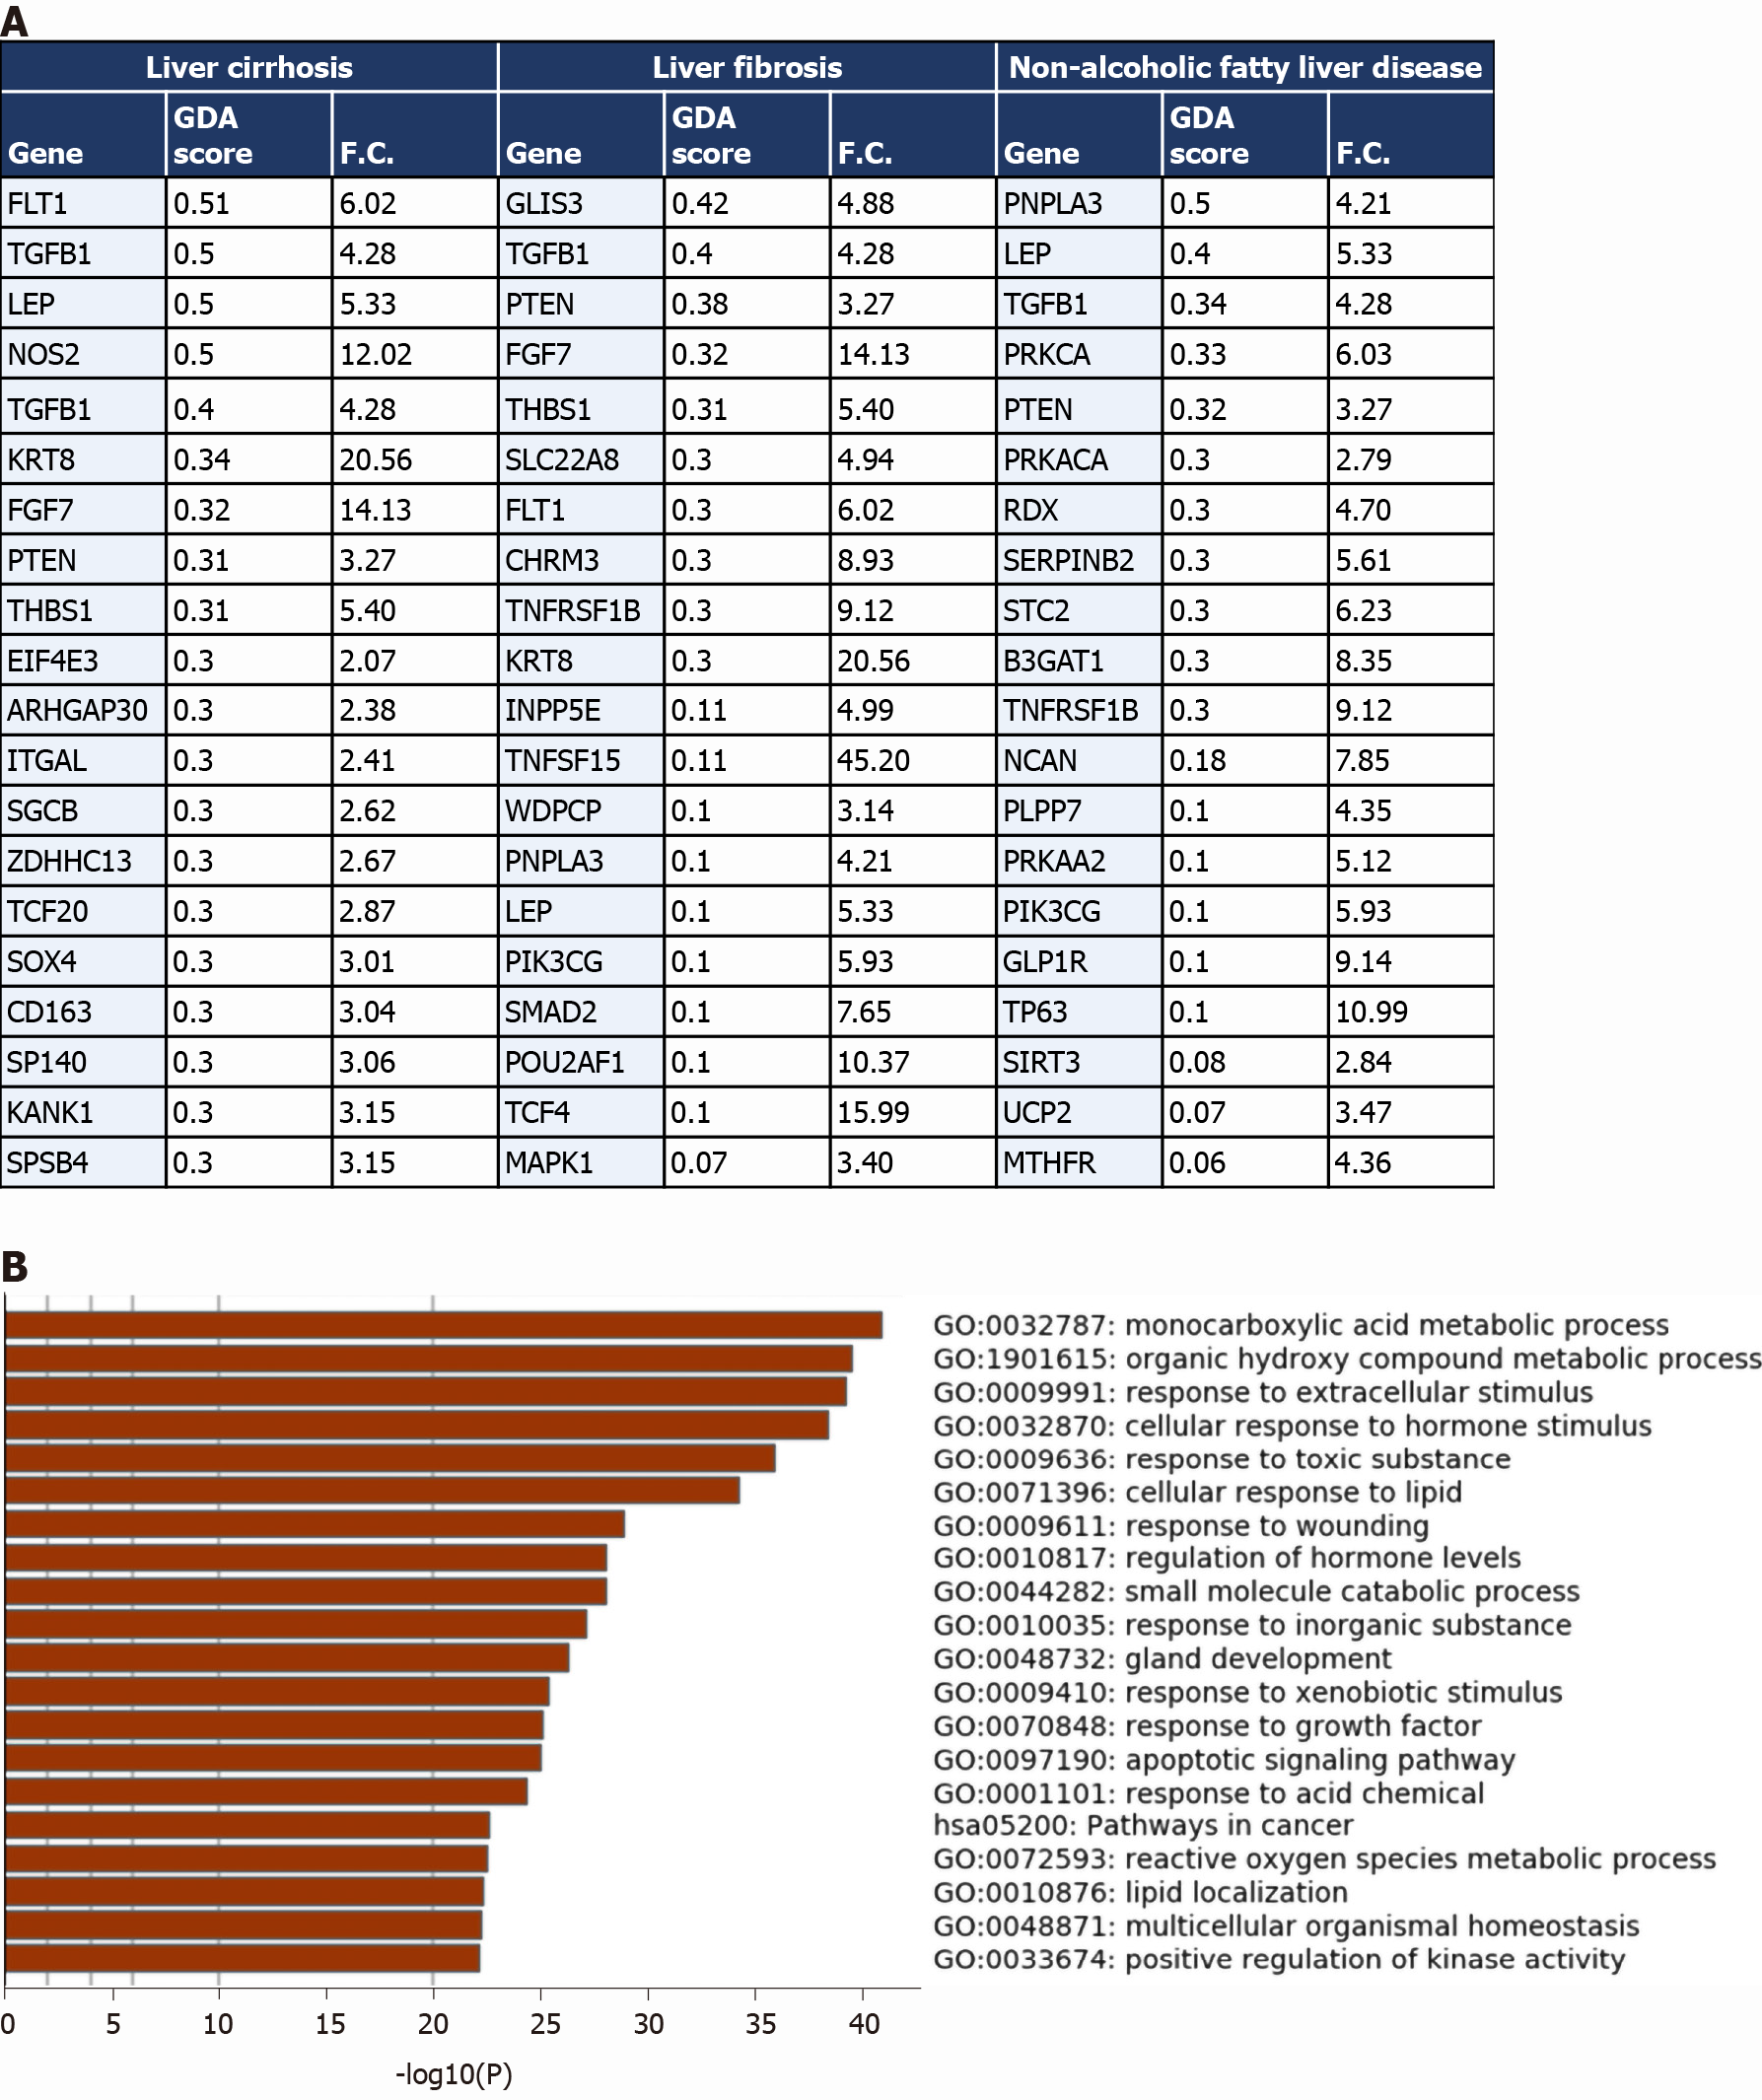
Figure 4 Comparative analysis of the overlapping transcriptomes mapping to severe coronavirus disease 2019 liver tissue, liver cirrhosis, liver fibrosis, and non-alcoholic fatty liver disease.
A: Top 20 Genes overlapping between the upregulated transcriptome of severe coronavirus disease 2019 (COVID-19) patients’ liver tissue samples and the signatures of liver cirrhosis, liver fibrosis, and non-alcoholic fatty liver disease retrieved from DisGeNET; gene disease association score was retrieved from DisGeNET and fold change is calculated using AltAnalyze to represent the difference in expression in COVID-19 liver tissue samples vs non-COVID-19 liver samples; B: functional clustering and pathway analysis of the overlapping transcriptome (upregulated and downregulated) of the severe COVID-19 patients’ liver tissues with the disease signature of liver cirrhosis, liver fibrosis, and non-alcoholic fatty liver disease analyzed using Metascape. GDA score: Gene disease association score; F.C.: Fold change.
- Citation: Hammoudeh SM, Hammoudeh AM, Bhamidimarri PM, Mahboub B, Halwani R, Hamid Q, Rahmani M, Hamoudi R. Insight into molecular mechanisms underlying hepatic dysfunction in severe COVID-19 patients using systems biology. World J Gastroenterol 2021; 27(21): 2850-2870
- URL: https://www.wjgnet.com/1007-9327/full/v27/i21/2850.htm
- DOI: https://dx.doi.org/10.3748/wjg.v27.i21.2850


