Copyright
©The Author(s) 2021.
World J Gastroenterol. Jun 7, 2021; 27(21): 2850-2870
Published online Jun 7, 2021. doi: 10.3748/wjg.v27.i21.2850
Published online Jun 7, 2021. doi: 10.3748/wjg.v27.i21.2850
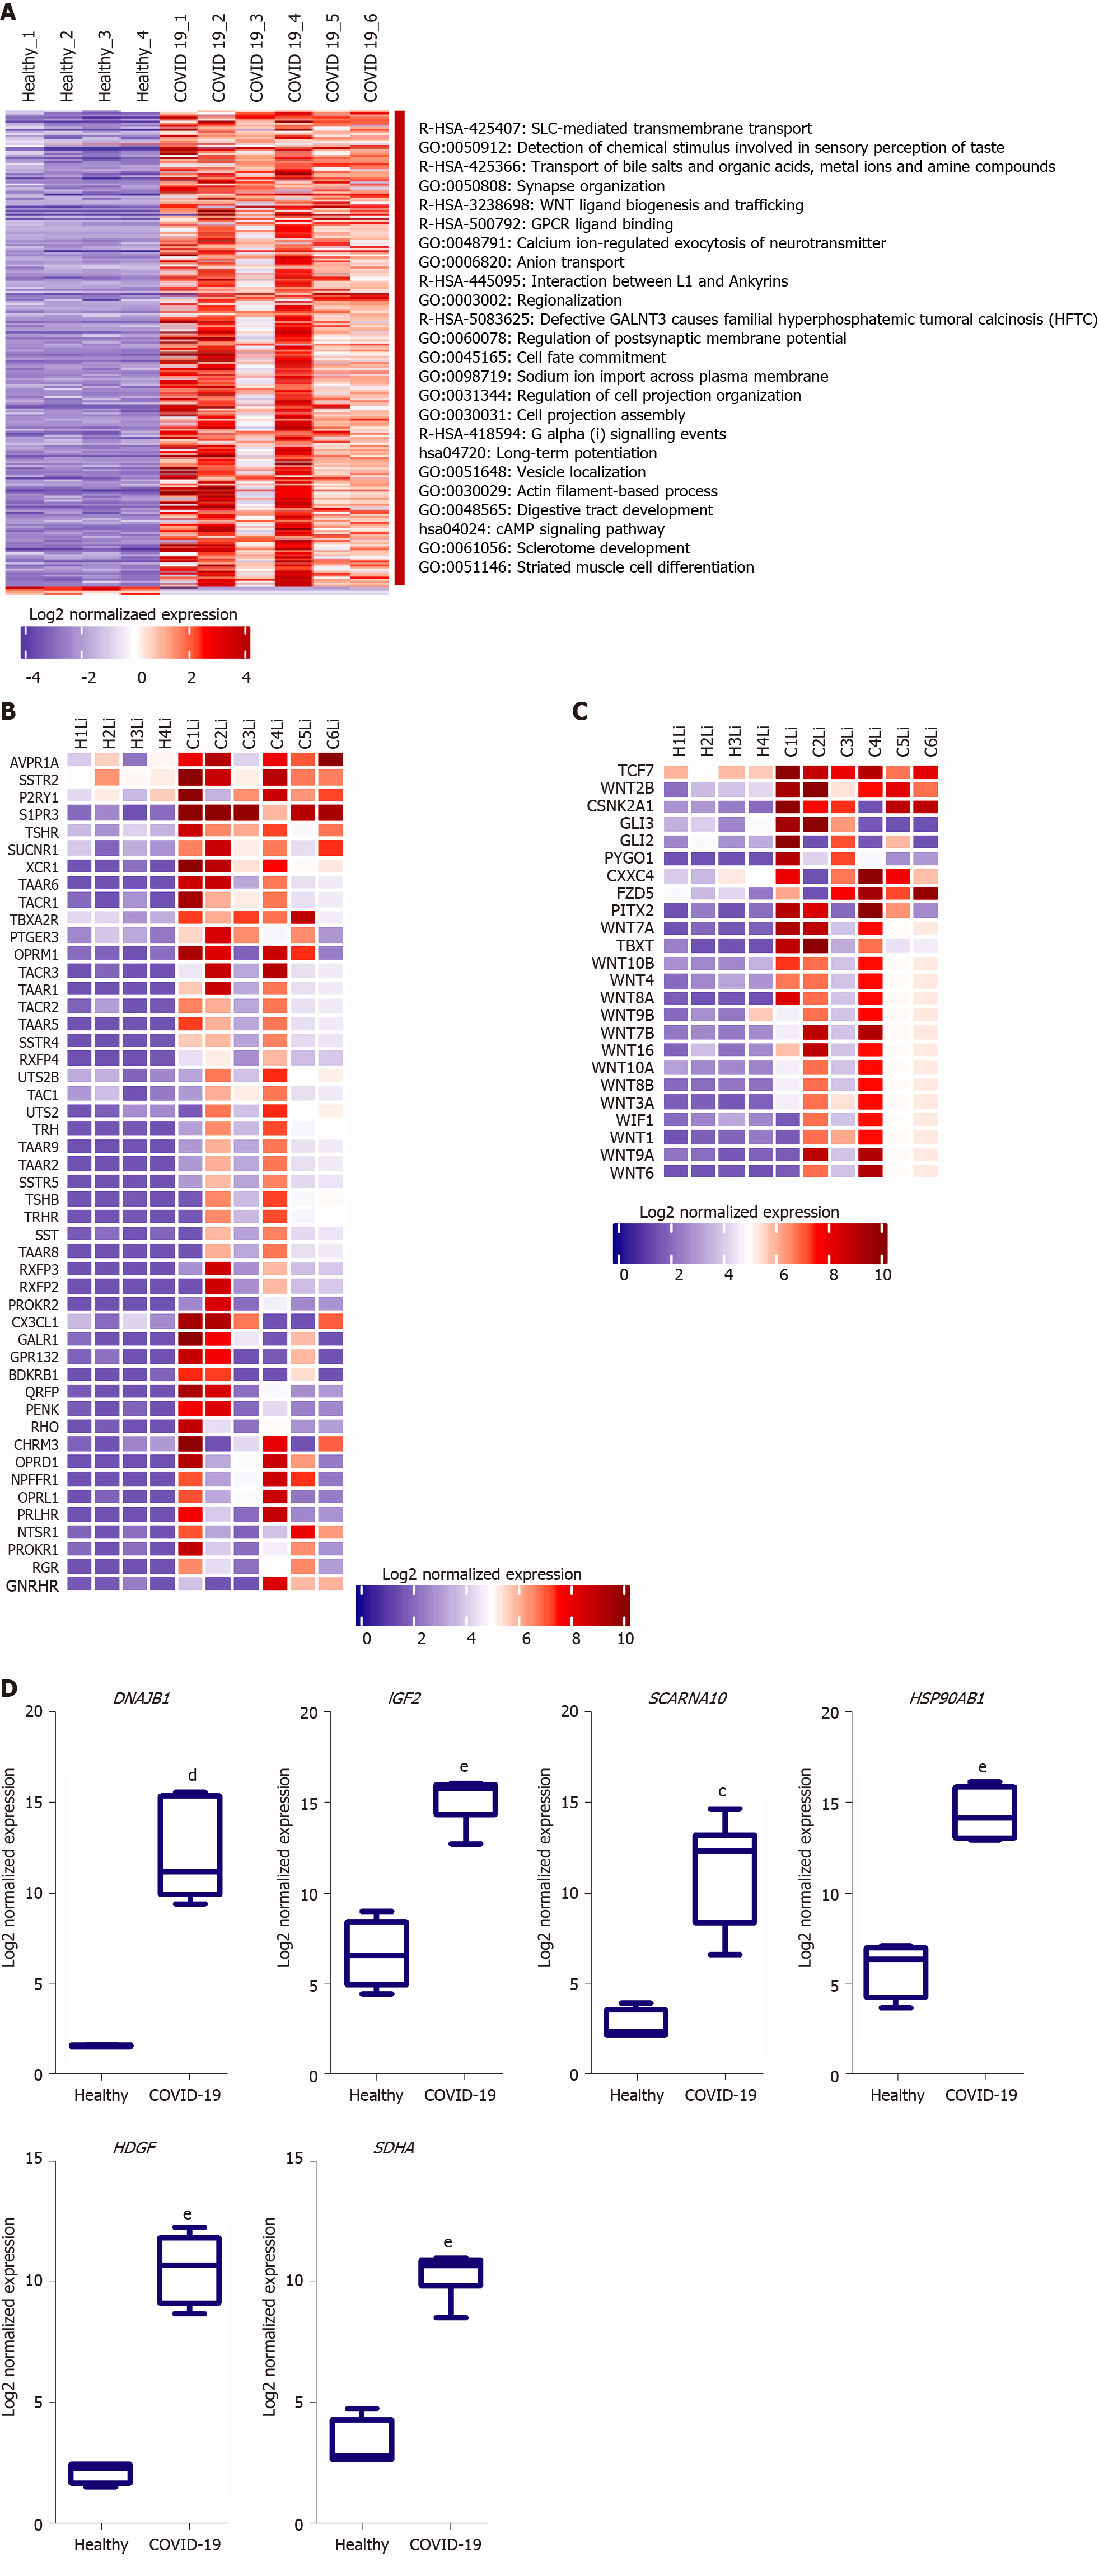
Figure 3 functional clustering analysis of the upregulated transcriptome of severe coronavirus disease 2019 patients liver autopsy tissues.
A: Heatmap representation of the differentially upregulated genes and subsequently enriched pathways and functional clusters in severe acute respiratory syndrome coronavirus 2 (SARS-CoV2) infected liver samples in comparison to baseline expression in healthy tissue samples; B and C: Heatmap representation of the log2 of normalized expression of transcripts implicated signaling through (B) Class A-rhodopsin-like receptors and (C) Class F-frizzled and smoothened receptors; D: Box plot representation of some of the top upregulated transcripts in SARS-CoV-2 infected liver tissue samples. Data presented as mean ± SE; aP < 0.05, bP < 0.01, cP < 0.001, dP < 0.0005, eP < 0.0001 coronavirus disease 2019 (COVID-19) vs Healthy. DNAJB1: DnaJ heat shock protein family (hsp40) member b1; IGF2: Insulin growth factor 2; SCARNA10: Small cajal body-specific rna 10; HSP90AB1: Heat shock protein 90 alpha family class B member 1; HDGF: Hepatoma-derived growth factor; SDHA: Succinate dehydrogenase complex flavoprotein subunit A.
- Citation: Hammoudeh SM, Hammoudeh AM, Bhamidimarri PM, Mahboub B, Halwani R, Hamid Q, Rahmani M, Hamoudi R. Insight into molecular mechanisms underlying hepatic dysfunction in severe COVID-19 patients using systems biology. World J Gastroenterol 2021; 27(21): 2850-2870
- URL: https://www.wjgnet.com/1007-9327/full/v27/i21/2850.htm
- DOI: https://dx.doi.org/10.3748/wjg.v27.i21.2850


