Copyright
©The Author(s) 2021.
World J Gastroenterol. Jan 14, 2021; 27(2): 189-207
Published online Jan 14, 2021. doi: 10.3748/wjg.v27.i2.189
Published online Jan 14, 2021. doi: 10.3748/wjg.v27.i2.189
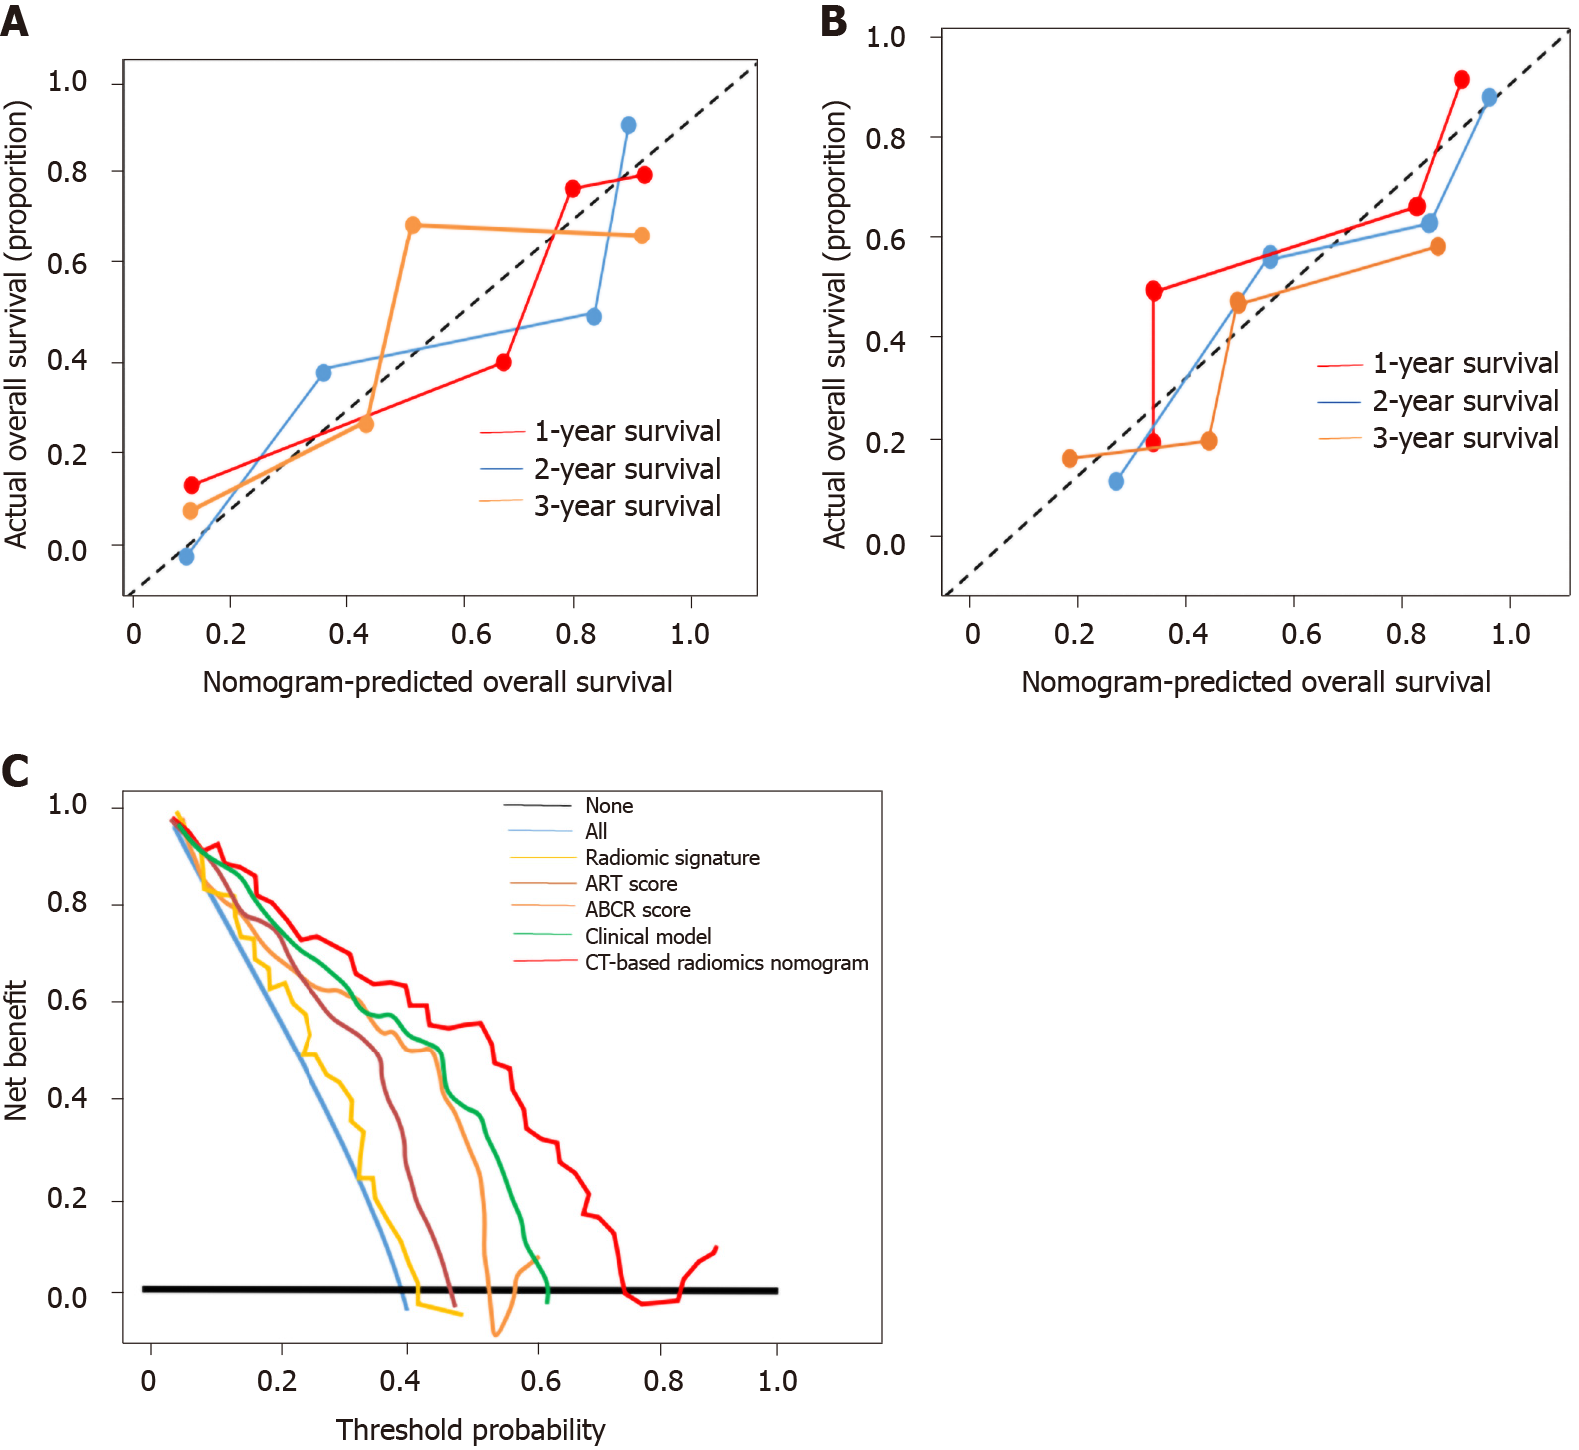
Figure 5 Calibration curve and clinical utility analyses.
A: Calibration curves of the nomogram on the training dataset. The Hosmer-Lemeshow test yielded a P value of 0.137 in the training dataset; B: Calibration curves of the nomogram on the validation dataset. The Hosmer-Lemeshow test yielded a P value of 0.165 in the validation dataset; C: Decision curve analysis for each model in the validation dataset. The Y-axis measures the net benefit, which is calculated by summing the benefits (true-positive findings) and subtracting the harms (false-positive findings). The decision curve showed that if the threshold probability is over 10%, the application of computed tomography-based radiomics nomogram to predict transarterial chemoembolization-refractoriness adds more benefit compared with the other scores/models. ART: Assessment for Retreatment with Transarterial Chemoembolization; ABCR: α-Fetoprotein, Barcelona Clinic Liver Cancer, Child-Pugh, and Response; CT: Computed tomography.
- Citation: Niu XK, He XF. Development of a computed tomography-based radiomics nomogram for prediction of transarterial chemoembolization refractoriness in hepatocellular carcinoma. World J Gastroenterol 2021; 27(2): 189-207
- URL: https://www.wjgnet.com/1007-9327/full/v27/i2/189.htm
- DOI: https://dx.doi.org/10.3748/wjg.v27.i2.189


