Copyright
©The Author(s) 2021.
World J Gastroenterol. May 21, 2021; 27(19): 2394-2414
Published online May 21, 2021. doi: 10.3748/wjg.v27.i19.2394
Published online May 21, 2021. doi: 10.3748/wjg.v27.i19.2394
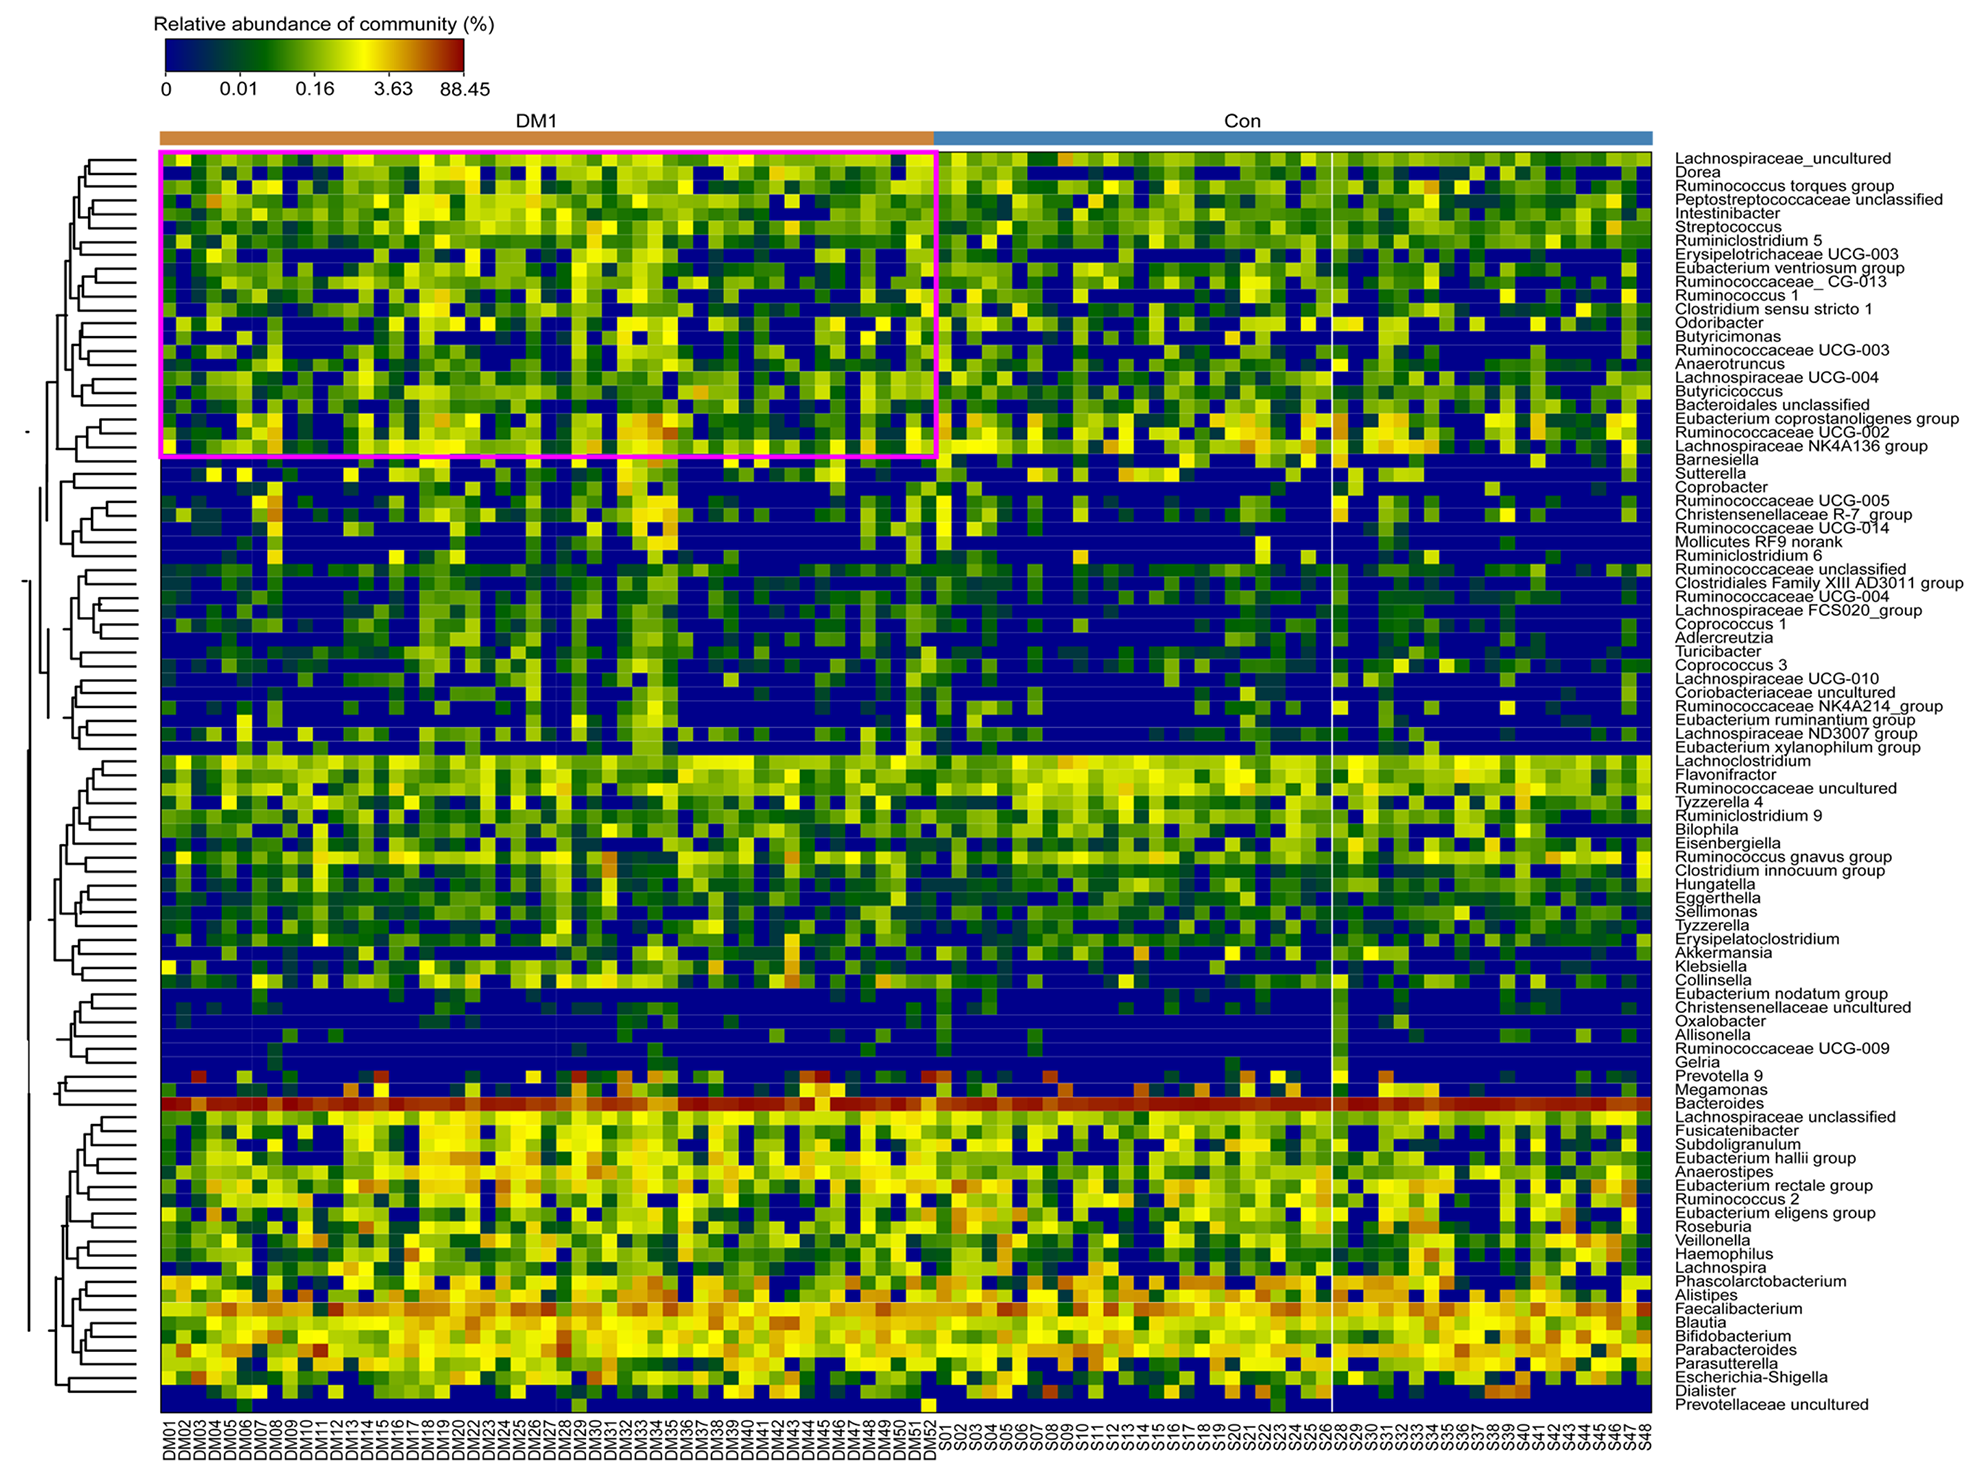
Figure 4 Heatmap of the type 1 diabetes mellitus-associated fecal microbiota at the genus level.
The color of the spots in the panel represents the relative abundance (normalized and log10-transformed) of the genus in each sample. Relative abundance of the bacteria in each genus is indicated by a gradient of color from blue (low abundance) to red (high abundance). Genera were organized according to Spearman’s correlation analysis, based on their relative abundances. Taxonomic classifications of the genus are shown on the right.
- Citation: Liu X, Cheng YW, Shao L, Sun SH, Wu J, Song QH, Zou HS, Ling ZX. Gut microbiota dysbiosis in Chinese children with type 1 diabetes mellitus: An observational study . World J Gastroenterol 2021; 27(19): 2394-2414
- URL: https://www.wjgnet.com/1007-9327/full/v27/i19/2394.htm
- DOI: https://dx.doi.org/10.3748/wjg.v27.i19.2394


