Copyright
©The Author(s) 2021.
World J Gastroenterol. May 21, 2021; 27(19): 2394-2414
Published online May 21, 2021. doi: 10.3748/wjg.v27.i19.2394
Published online May 21, 2021. doi: 10.3748/wjg.v27.i19.2394
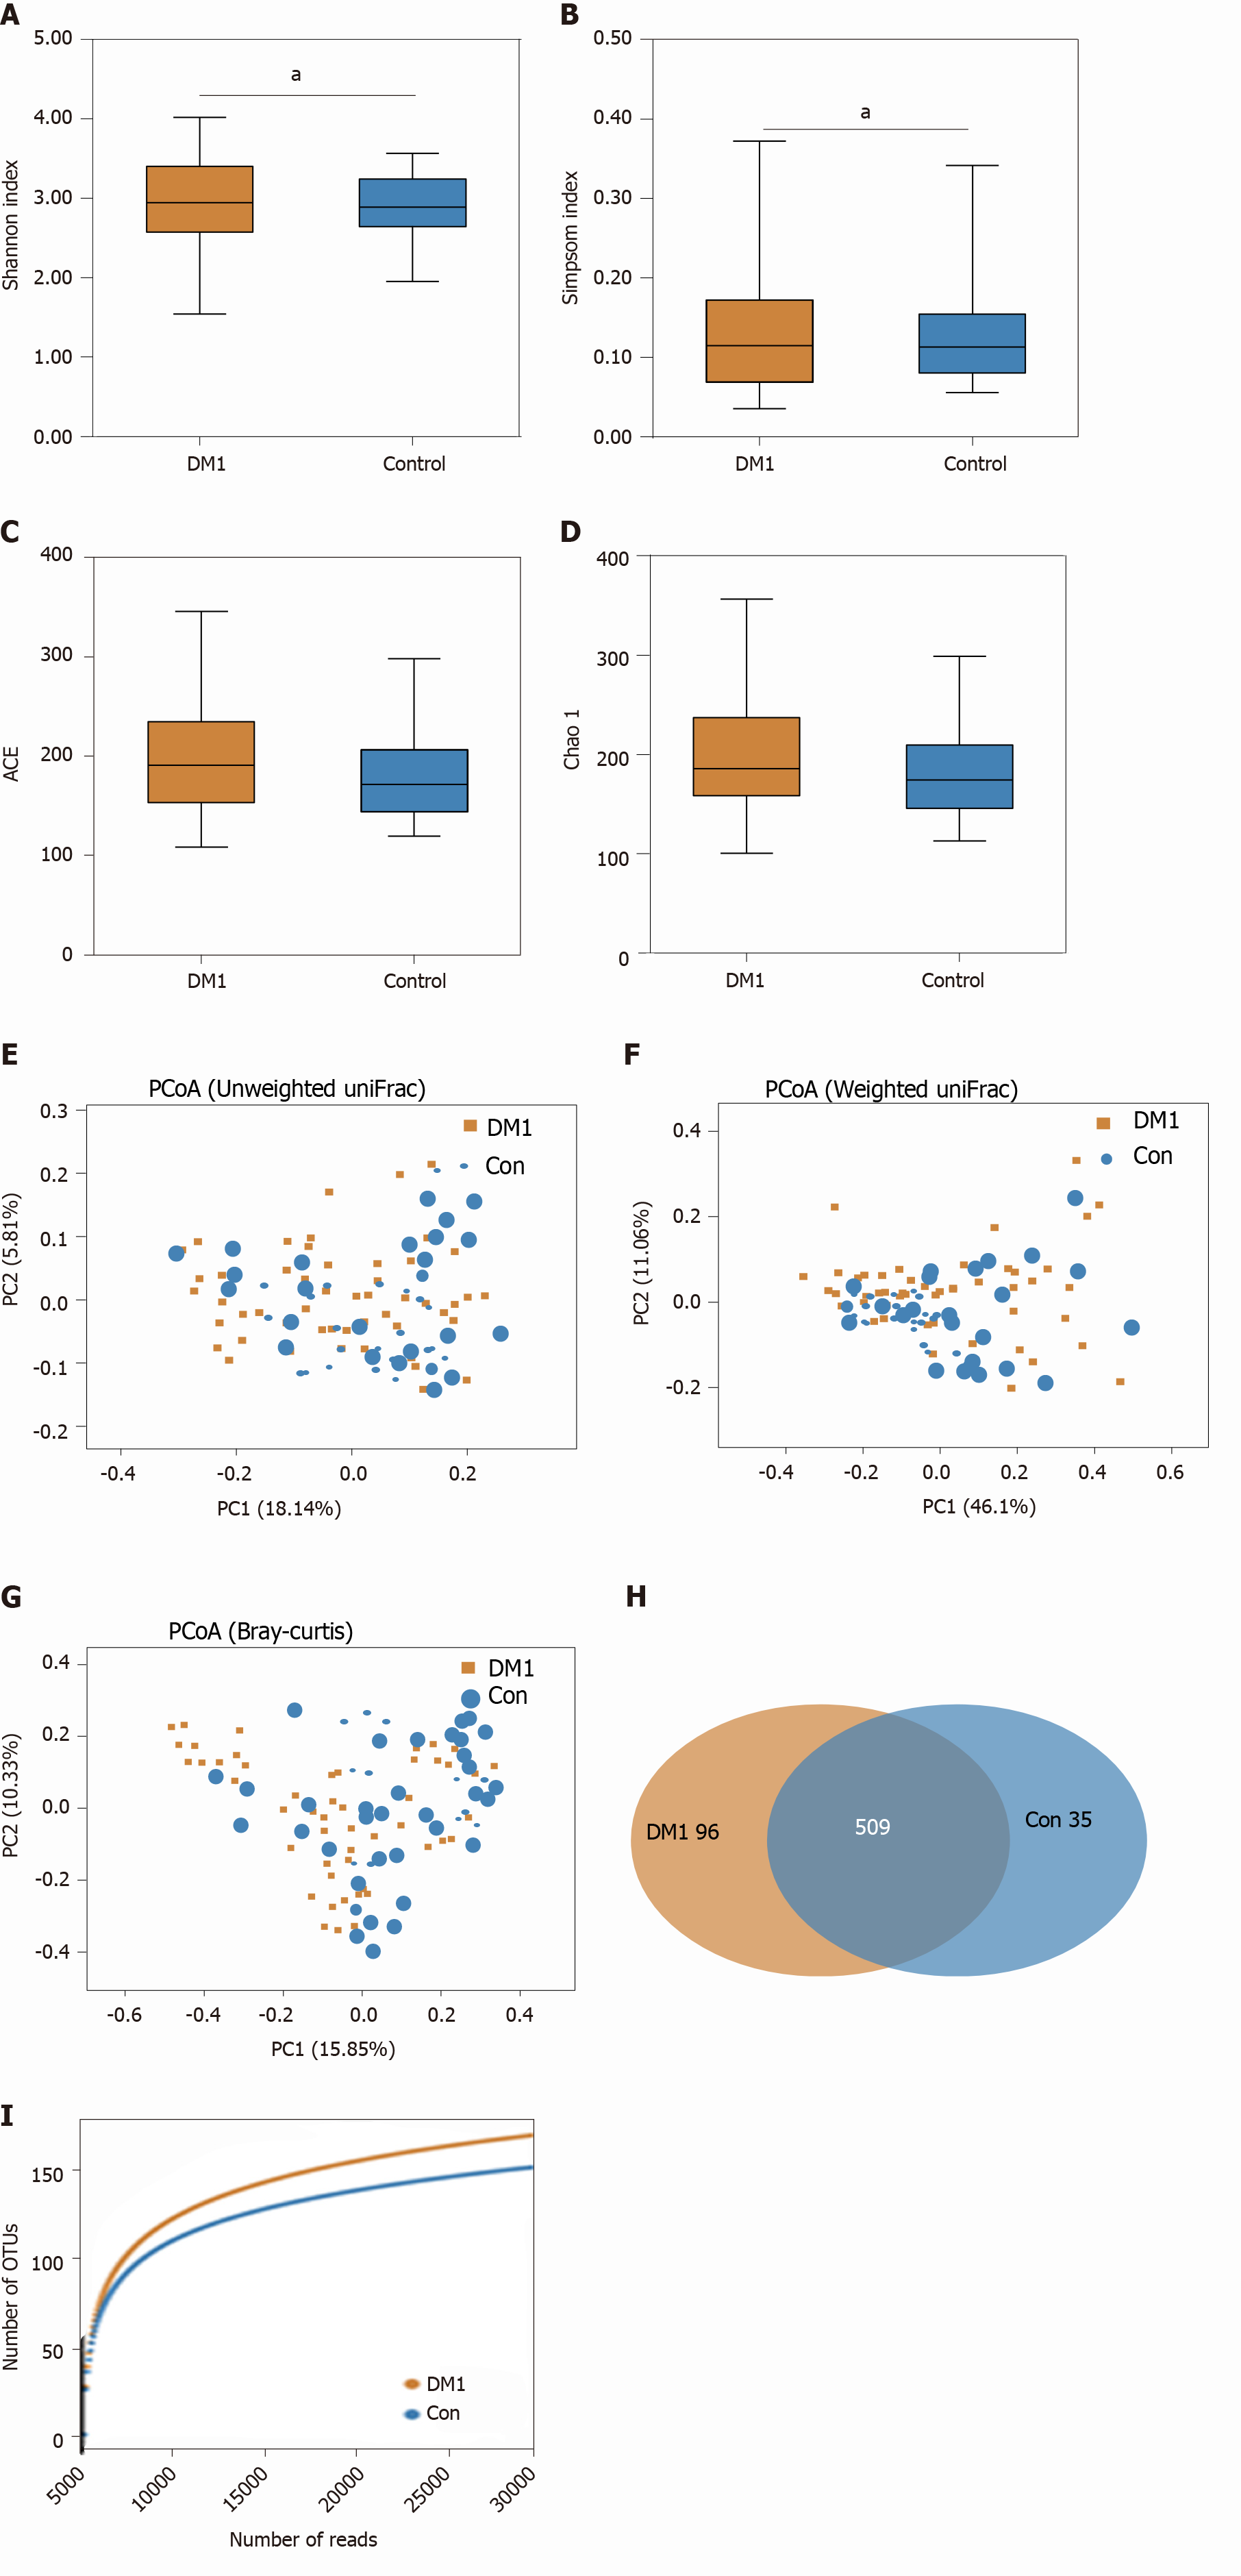
Figure 2 Altered bacterial diversity and richness of the fecal microbiota in Chinese children with type 1 diabetes mellitus.
A-D: The diversity indices, such as Shannon (A), and Simpson (B), and the richness indices, such as the abundance-based coverage estimator (C), and Chao1 (D), were used to evaluate the overall structure of the fecal microbiota in patients with type 1 diabetes mellitus (T1DM) and healthy controls. Data are presented as the mean ± SD. Unpaired t-tests (two-tailed) were used to analyze variation between the two groups; E-G: Principal coordinate analysis plots of individual fecal microbiota based on unweighted (E) and weighted (F) UniFrac distance, and Bray–Curtis dissimilarity (G) in patients with T1DM and healthy controls. Each symbol represents a single sample; H: Venn diagram illustrating the overlap of operational taxonomic units (OTUs) in T1DM-associated fecal microbiota between the two groups; I: Rarefaction curves used to estimate the richness (at a 97% level of similarity) of T1DM-associated fecal microbiota between the two groups. The vertical axis shows the expected number of OTUs after sampling the number of tags or sequences shown on the horizontal axis. aP < 0.05. OTUs: Operational taxonomic units; ACE: Abundance-based coverage estimator; PCoA: Principal coordinate analysis; Con: Control; DM1: Type 1 diabetes mellitus.
- Citation: Liu X, Cheng YW, Shao L, Sun SH, Wu J, Song QH, Zou HS, Ling ZX. Gut microbiota dysbiosis in Chinese children with type 1 diabetes mellitus: An observational study . World J Gastroenterol 2021; 27(19): 2394-2414
- URL: https://www.wjgnet.com/1007-9327/full/v27/i19/2394.htm
- DOI: https://dx.doi.org/10.3748/wjg.v27.i19.2394


