Copyright
©The Author(s) 2021.
World J Gastroenterol. May 21, 2021; 27(19): 2376-2393
Published online May 21, 2021. doi: 10.3748/wjg.v27.i19.2376
Published online May 21, 2021. doi: 10.3748/wjg.v27.i19.2376
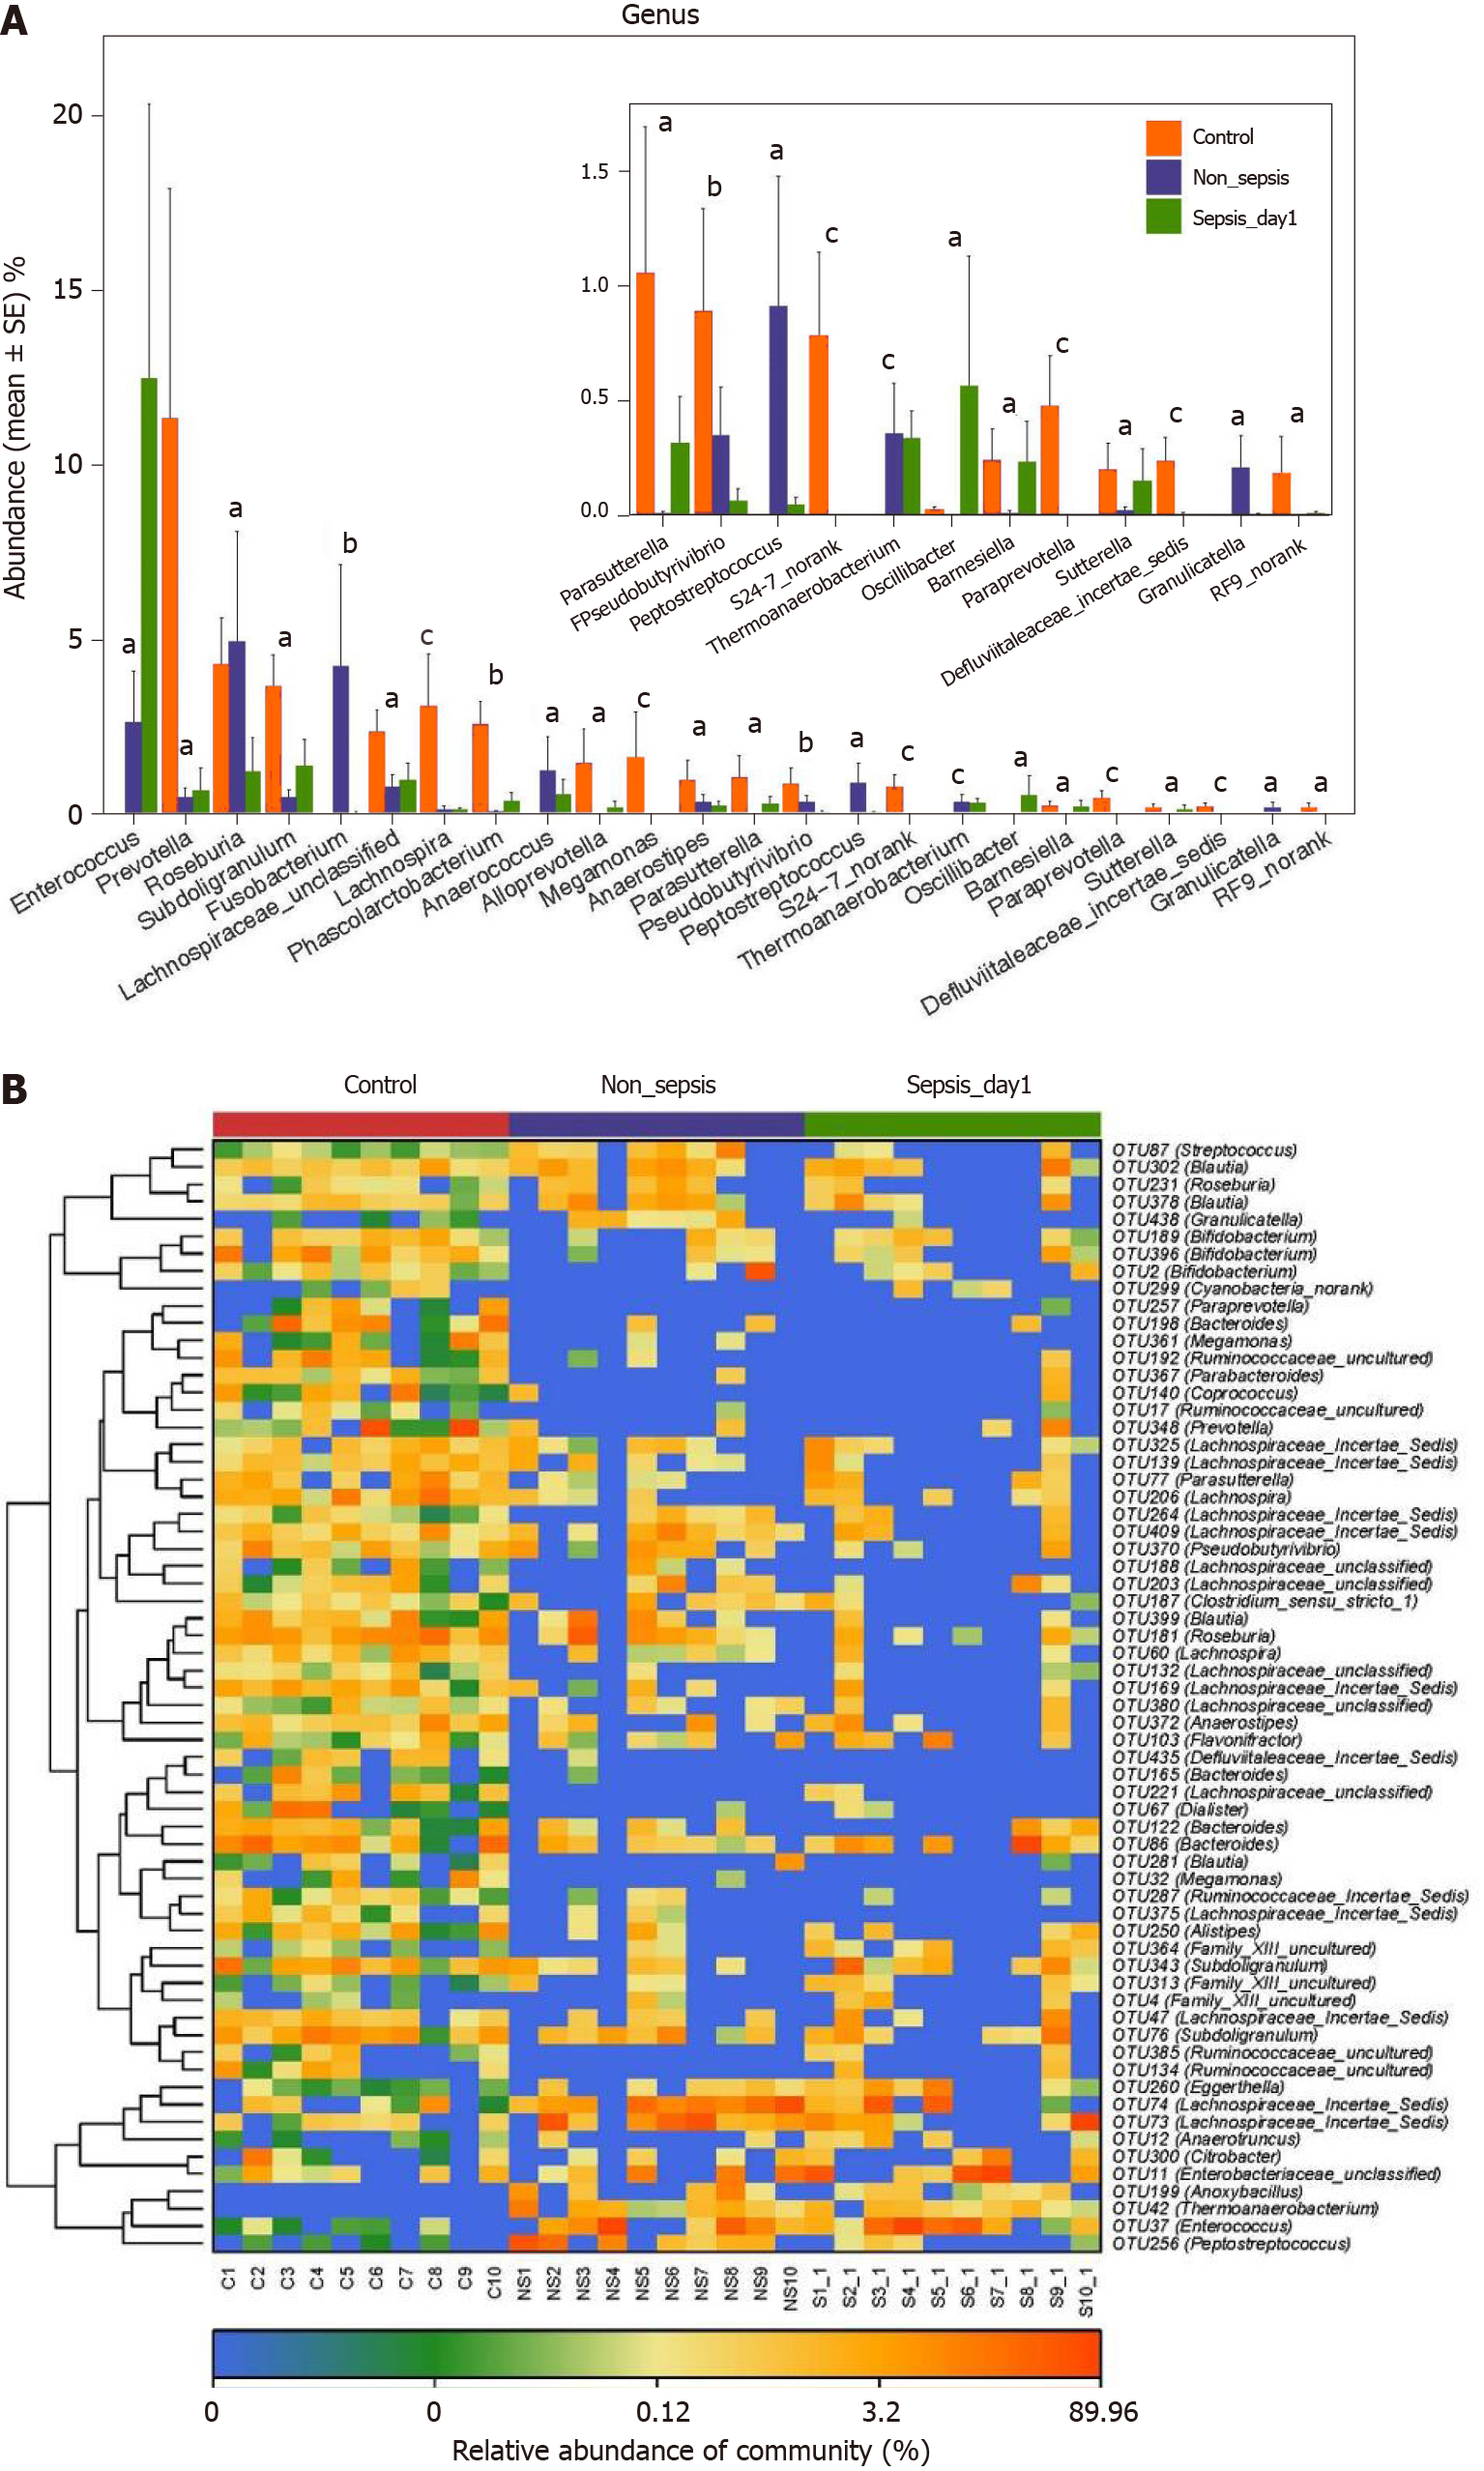
Figure 4 Key phylotypes showing significant differences among normal individuals, sepsis patients, and non-sepsis patients.
A: Comparison of the fecal microbiota at the genus level among the three groups. The average abundance of each genus is depicted as the mean ± SE. P values were calculated using the Kruskal–Wallis rank-sum test: aP < 0.05; bP < 0.01, cP < 0.001; B: Heatmap representing the relative abundance of differential operational taxonomic units (OTUs) among the three groups. The key OTUs whose relative abundance was above 1%, as per random forest-based models are displayed in the “figure”.
- Citation: Yang XJ, Liu D, Ren HY, Zhang XY, Zhang J, Yang XJ. Effects of sepsis and its treatment measures on intestinal flora structure in critical care patients. World J Gastroenterol 2021; 27(19): 2376-2393
- URL: https://www.wjgnet.com/1007-9327/full/v27/i19/2376.htm
- DOI: https://dx.doi.org/10.3748/wjg.v27.i19.2376


