Copyright
©The Author(s) 2021.
World J Gastroenterol. Apr 28, 2021; 27(16): 1805-1815
Published online Apr 28, 2021. doi: 10.3748/wjg.v27.i16.1805
Published online Apr 28, 2021. doi: 10.3748/wjg.v27.i16.1805
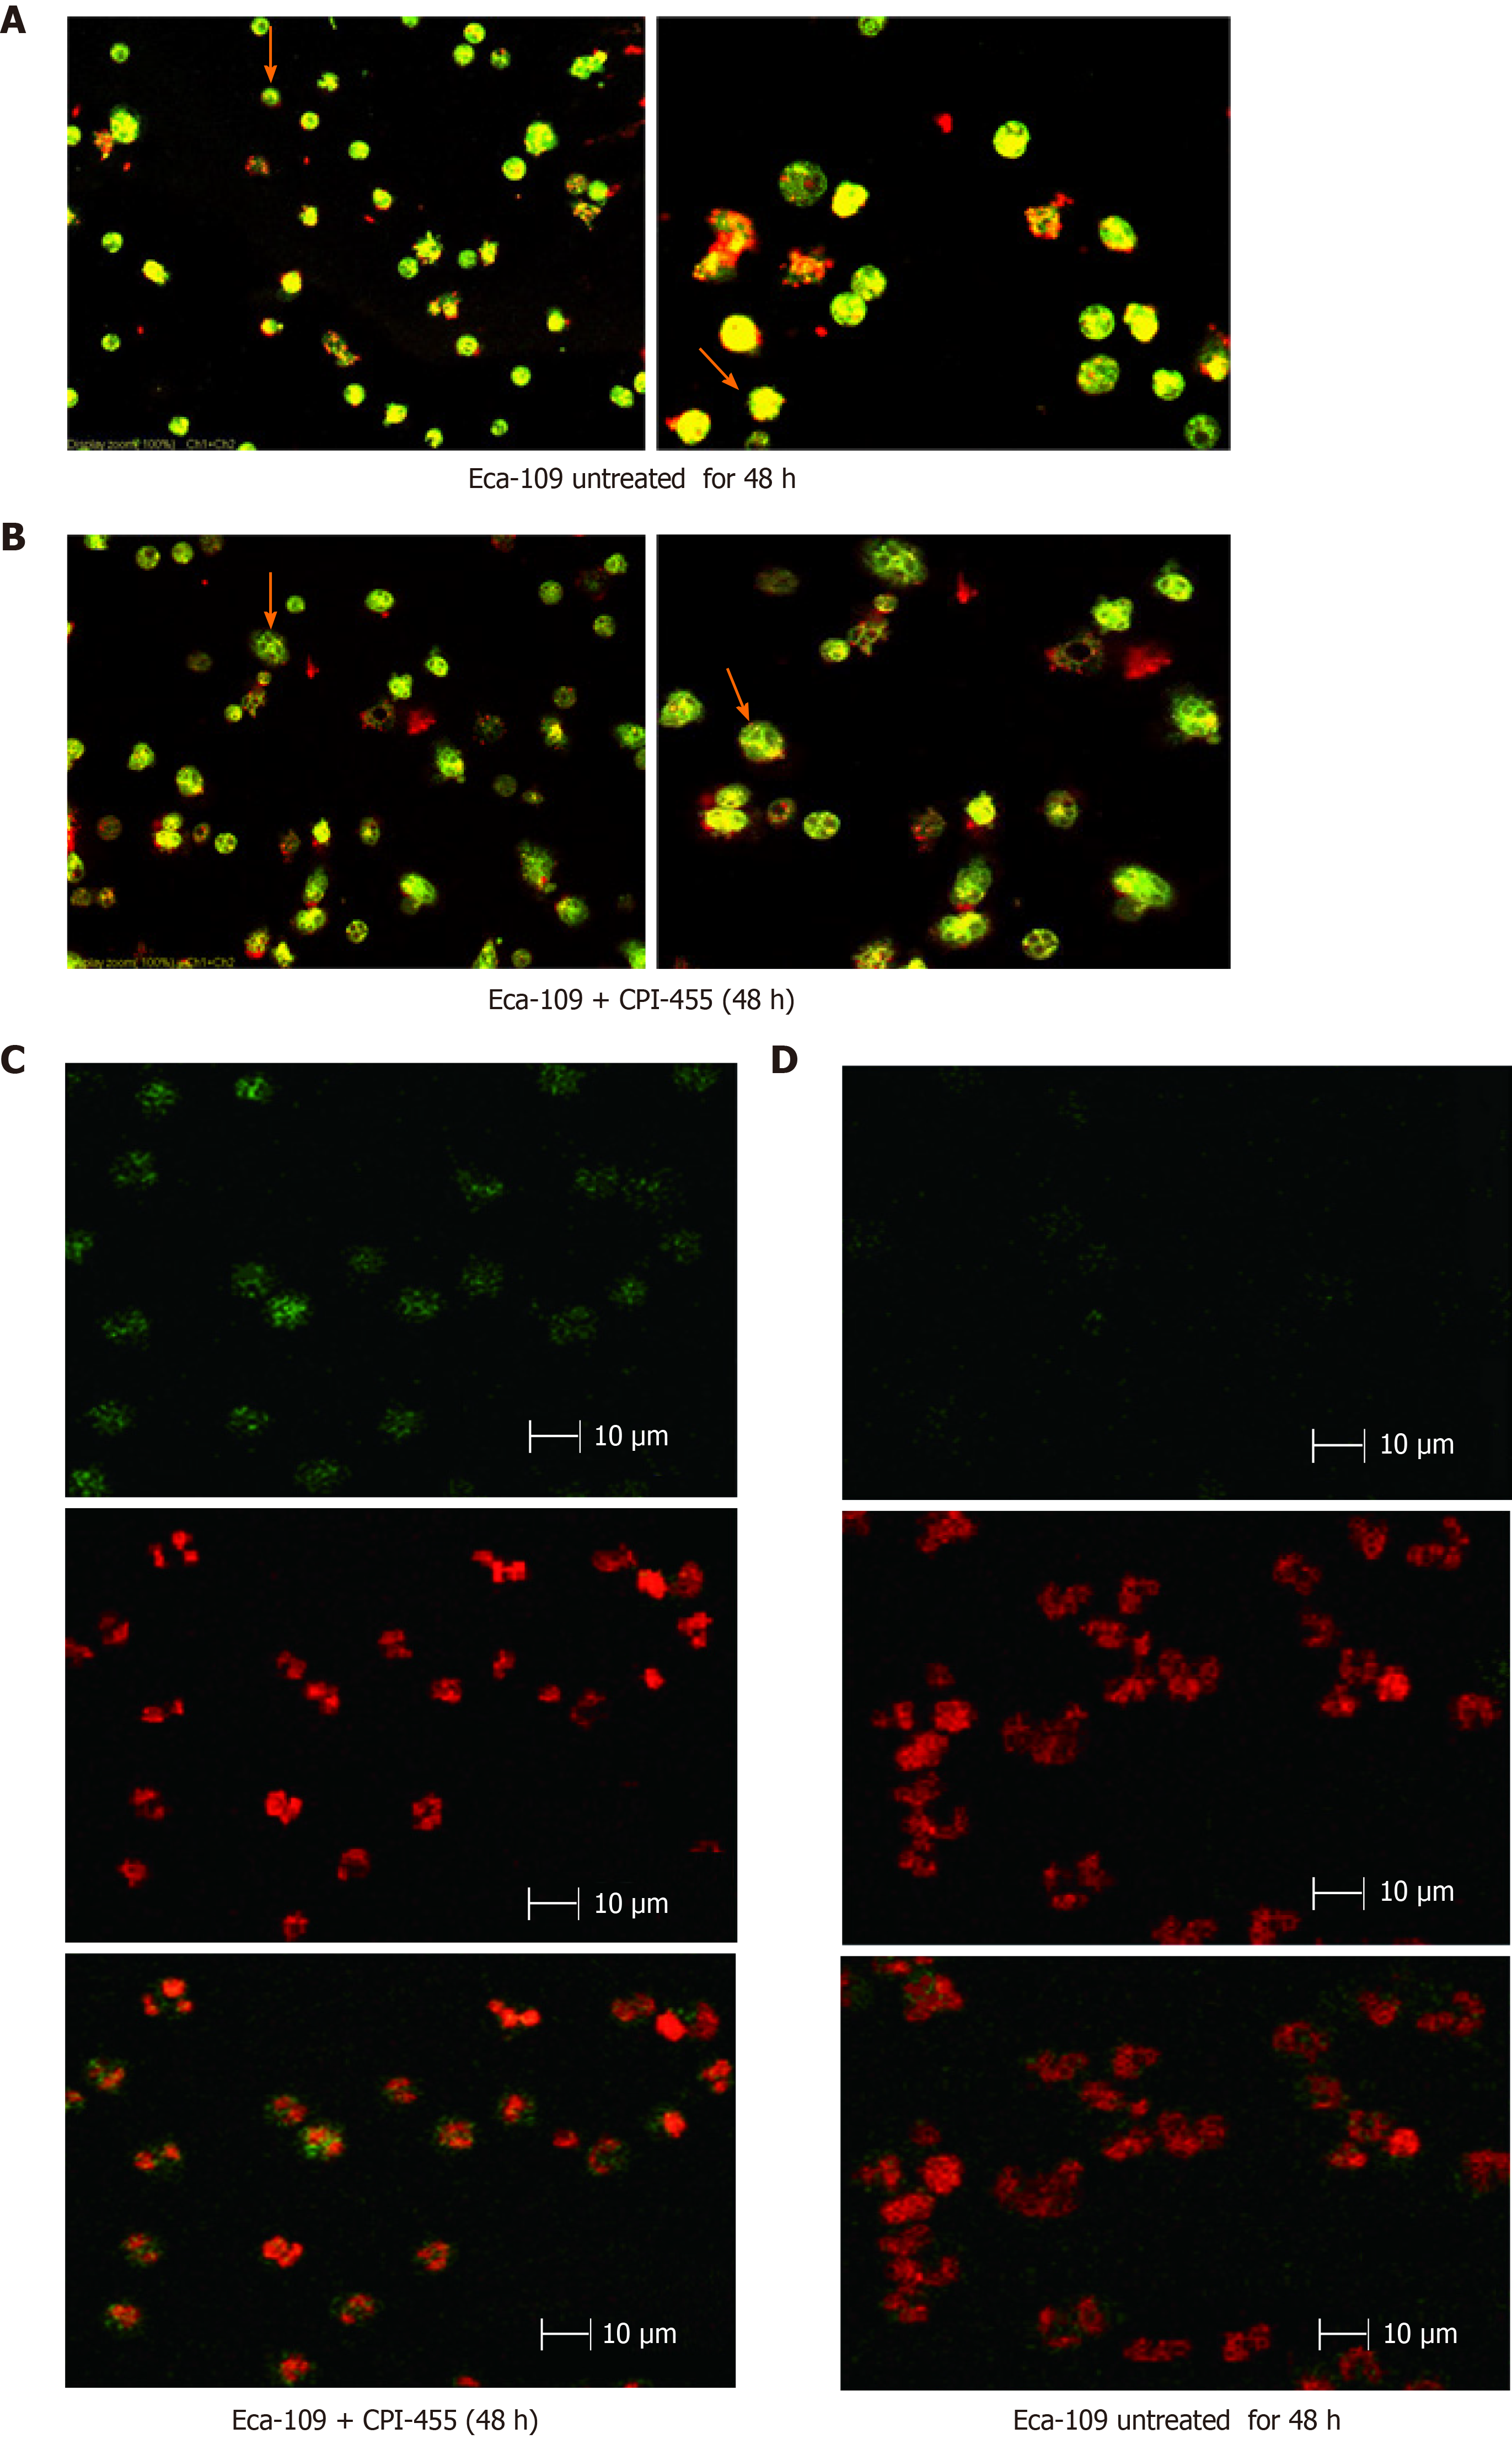
Figure 2 Changes in Eca109 cells after 48 h culture with and without CPI-455 treatment.
Left panels show the morphology of the mitochondria of Eca109 cells. A: Arrows indicate mitochondria with complete and clear structure. B: Arrows indicate mitochondria with a fuzzy structure and weak staining of cells. Right panels show TUNEL assay results (bar = 10 μm) and laser confocal scanning microscopy × 600 of nuclear staining and DNA fragmentation of Eca109 cells C: without, and D: with CPI-455 treatment. Data are reported as means ± SE (n = 3).
- Citation: Xue XJ, Li FR, Yu J. Mitochondrial pathway of the lysine demethylase 5C inhibitor CPI-455 in the Eca-109 esophageal squamous cell carcinoma cell line. World J Gastroenterol 2021; 27(16): 1805-1815
- URL: https://www.wjgnet.com/1007-9327/full/v27/i16/1805.htm
- DOI: https://dx.doi.org/10.3748/wjg.v27.i16.1805


