Copyright
©The Author(s) 2021.
World J Gastroenterol. Apr 28, 2021; 27(16): 1785-1804
Published online Apr 28, 2021. doi: 10.3748/wjg.v27.i16.1785
Published online Apr 28, 2021. doi: 10.3748/wjg.v27.i16.1785
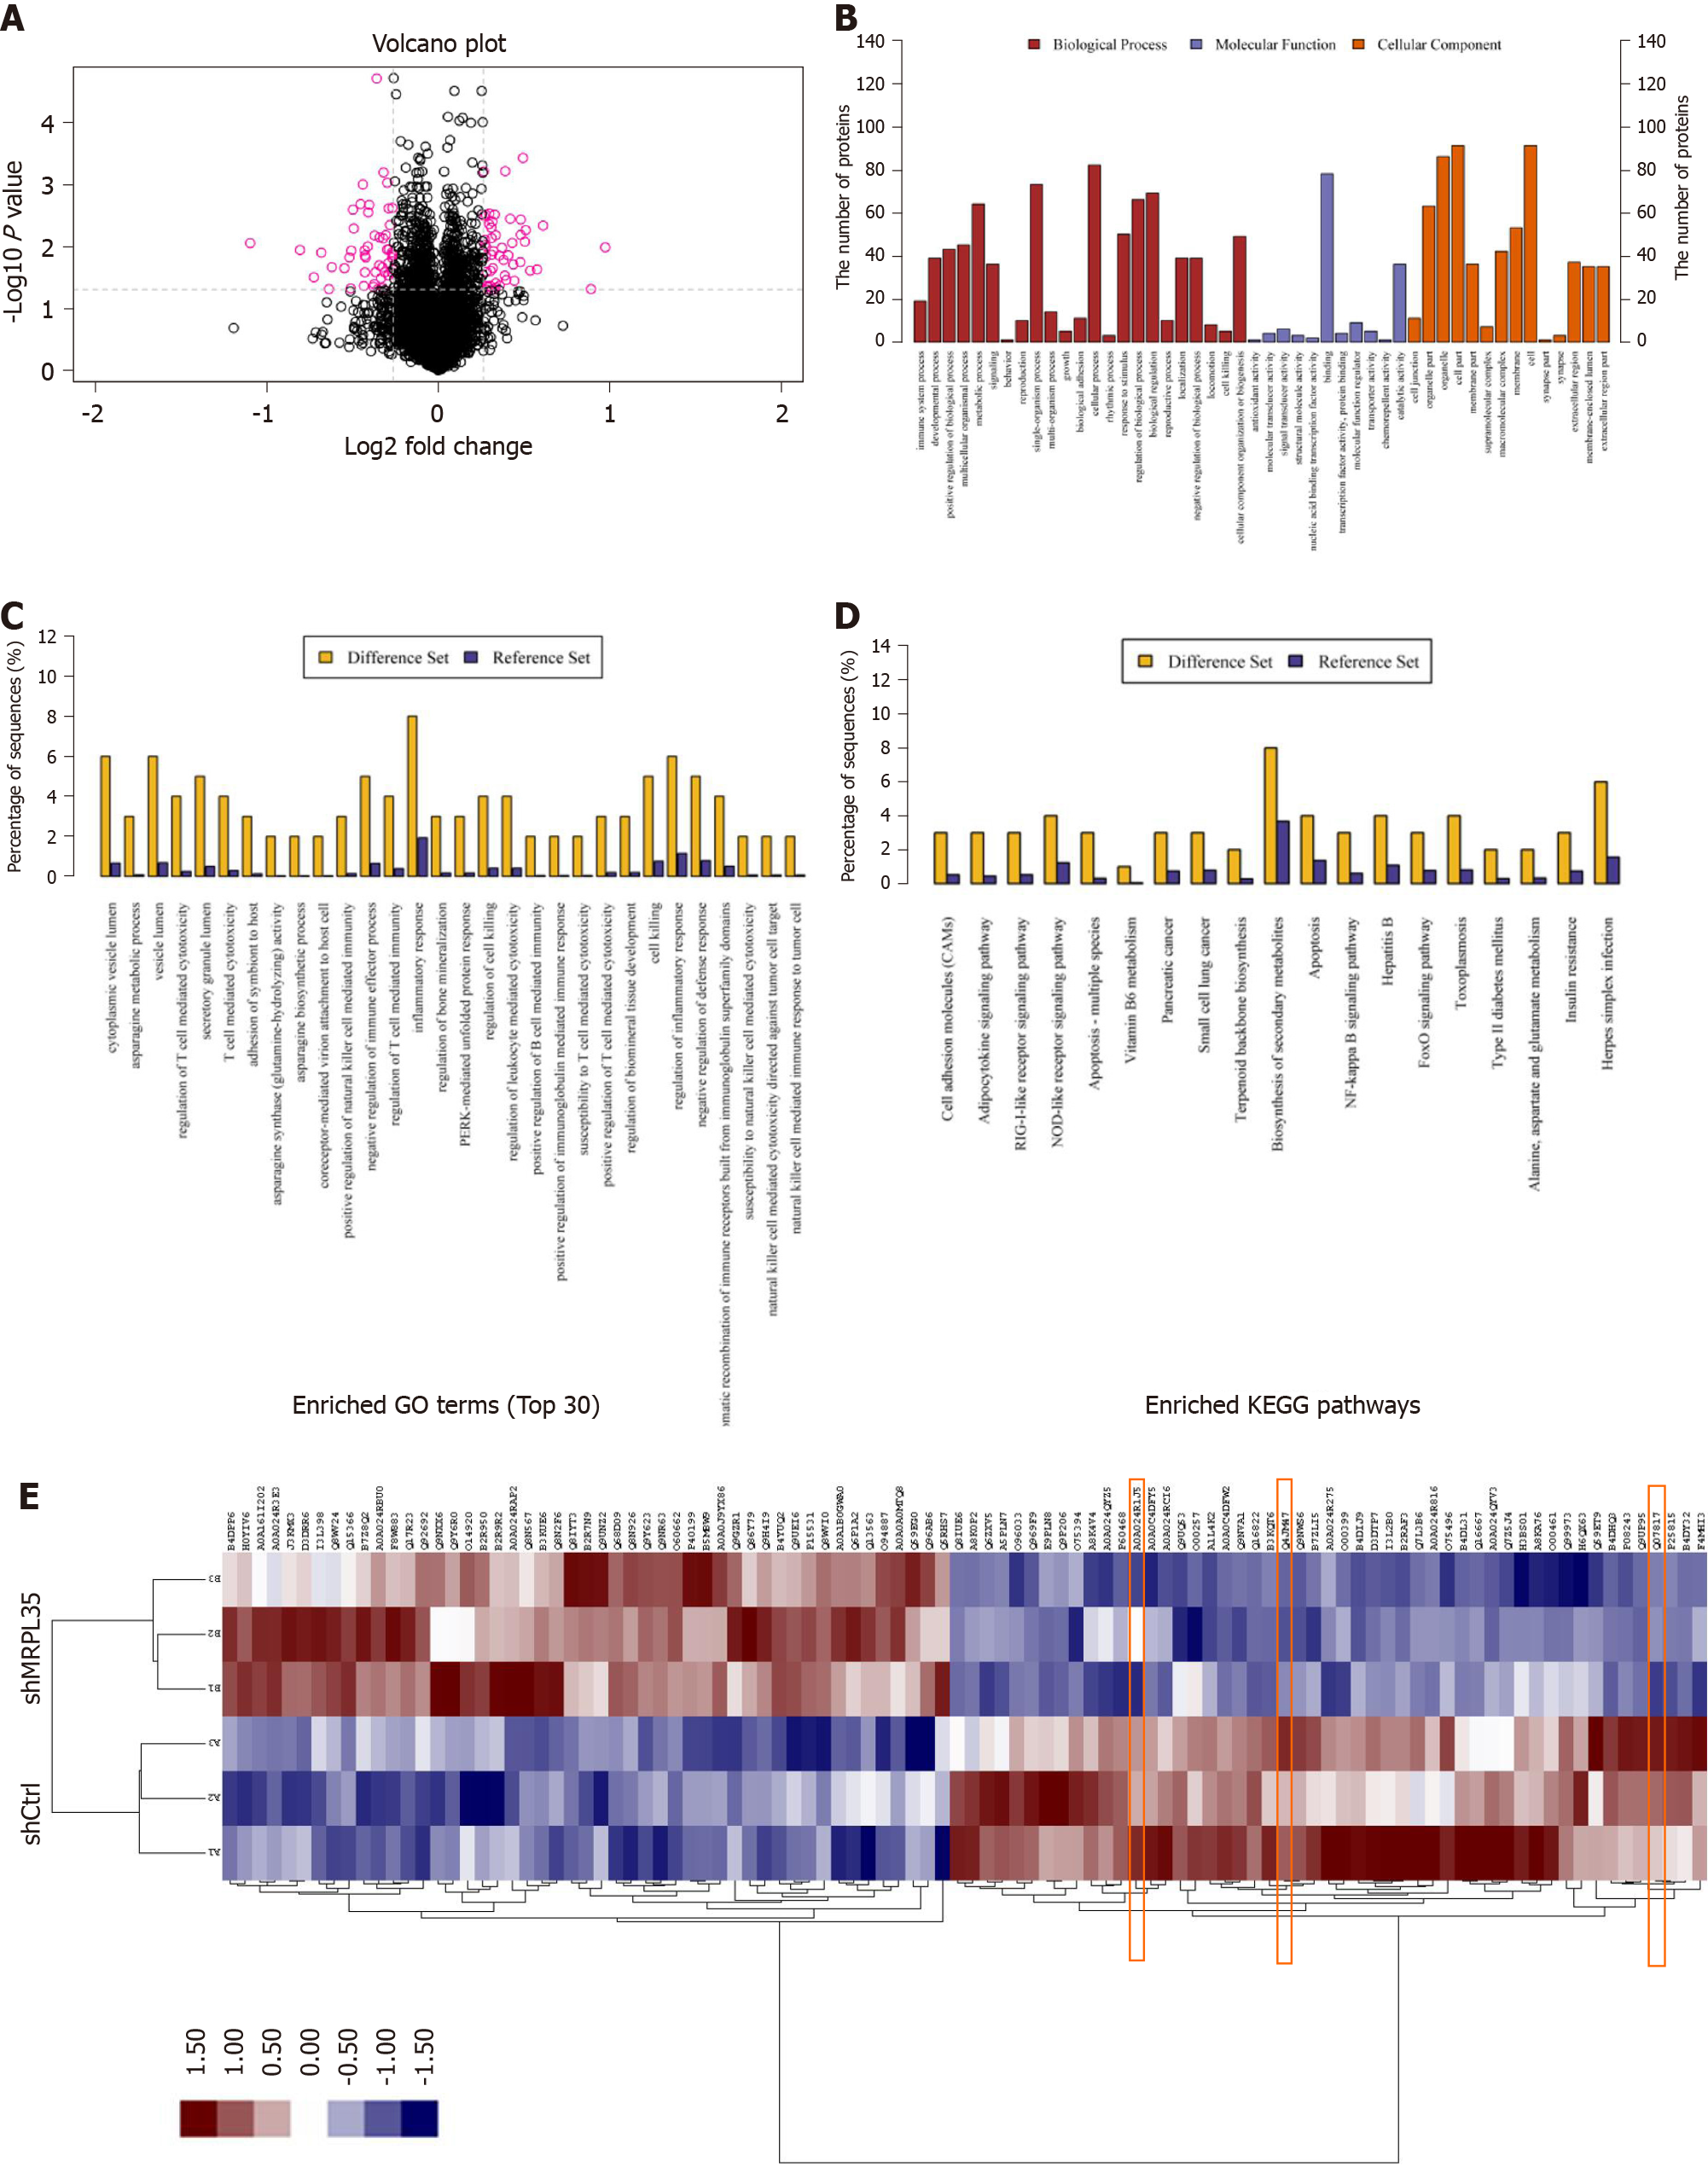
Figure 6 Proteomic and bioinformatic analysis of identified proteins.
A: A total of 5993 proteins were identified by isobaric tags for relative and absolute quantification. Red circle indicates 100 differentially expressed proteins (DEPs); B: The result of Gene Ontology annotation. The identified proteins were categorized into three types: Biological process, molecular function, and cellular component; C: Enriched Gene Ontology annotation statistics of DEPs; D: Enriched KEGG pathway statistics of DEPs; E: Protein cluster analysis of DEPs. The red box part is AGR2, PICK1, and BCL-XL. shCtrl: Negative control virus; shMRPL35: Lentiviral particles of MRPL35.
- Citation: Yuan L, Li JX, Yang Y, Chen Y, Ma TT, Liang S, Bu Y, Yu L, Nan Y. Depletion of MRPL35 inhibits gastric carcinoma cell proliferation by regulating downstream signaling proteins. World J Gastroenterol 2021; 27(16): 1785-1804
- URL: https://www.wjgnet.com/1007-9327/full/v27/i16/1785.htm
- DOI: https://dx.doi.org/10.3748/wjg.v27.i16.1785


