Copyright
©The Author(s) 2021.
World J Gastroenterol. Mar 14, 2021; 27(10): 939-958
Published online Mar 14, 2021. doi: 10.3748/wjg.v27.i10.939
Published online Mar 14, 2021. doi: 10.3748/wjg.v27.i10.939
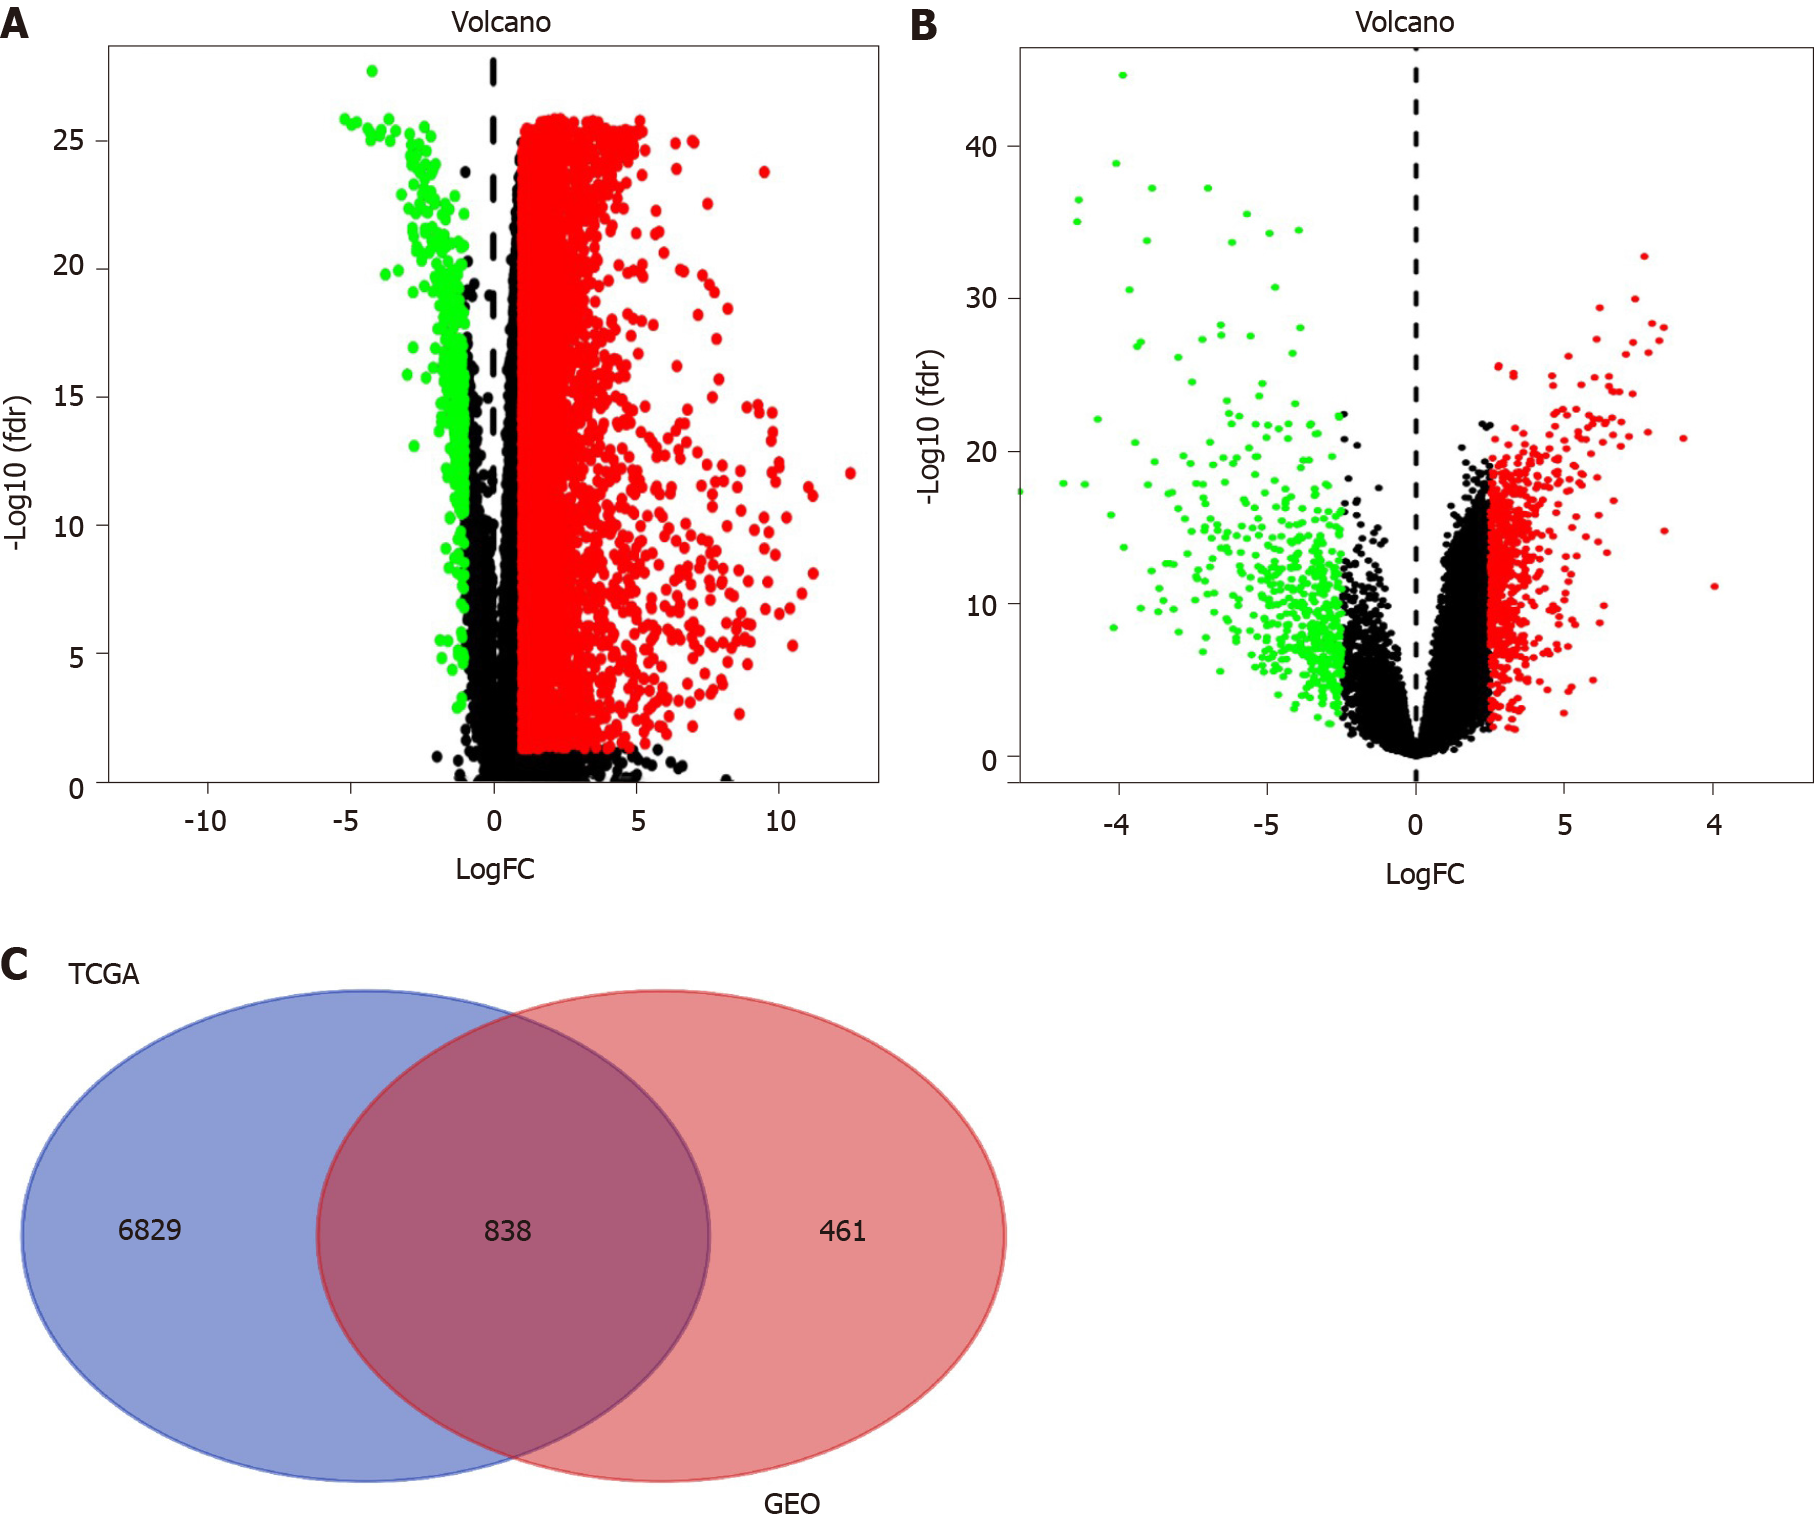
Figure 2 Volcano and Venn diagrams of differentially expressed genes.
A: Differential gene analysis of The Cancer Genome Atlas (TCGA) datasets; B: Differential gene analysis of Gene Expression Omnibus (GEO) datasets; C: The TCGA and GEO datasets show an overlap of 838 genes. Upregulated genes are marked in red; downregulated genes are marked in light green. TCGA: The Cancer Genome Atlas; GEO: Gene Expression Omnibus.
- Citation: Li M, Shang H, Wang T, Yang SQ, Li L. Huanglian decoction suppresses the growth of hepatocellular carcinoma cells by reducing CCNB1 expression. World J Gastroenterol 2021; 27(10): 939-958
- URL: https://www.wjgnet.com/1007-9327/full/v27/i10/939.htm
- DOI: https://dx.doi.org/10.3748/wjg.v27.i10.939


