Copyright
©The Author(s) 2020.
World J Gastroenterol. Feb 28, 2020; 26(8): 789-803
Published online Feb 28, 2020. doi: 10.3748/wjg.v26.i8.789
Published online Feb 28, 2020. doi: 10.3748/wjg.v26.i8.789
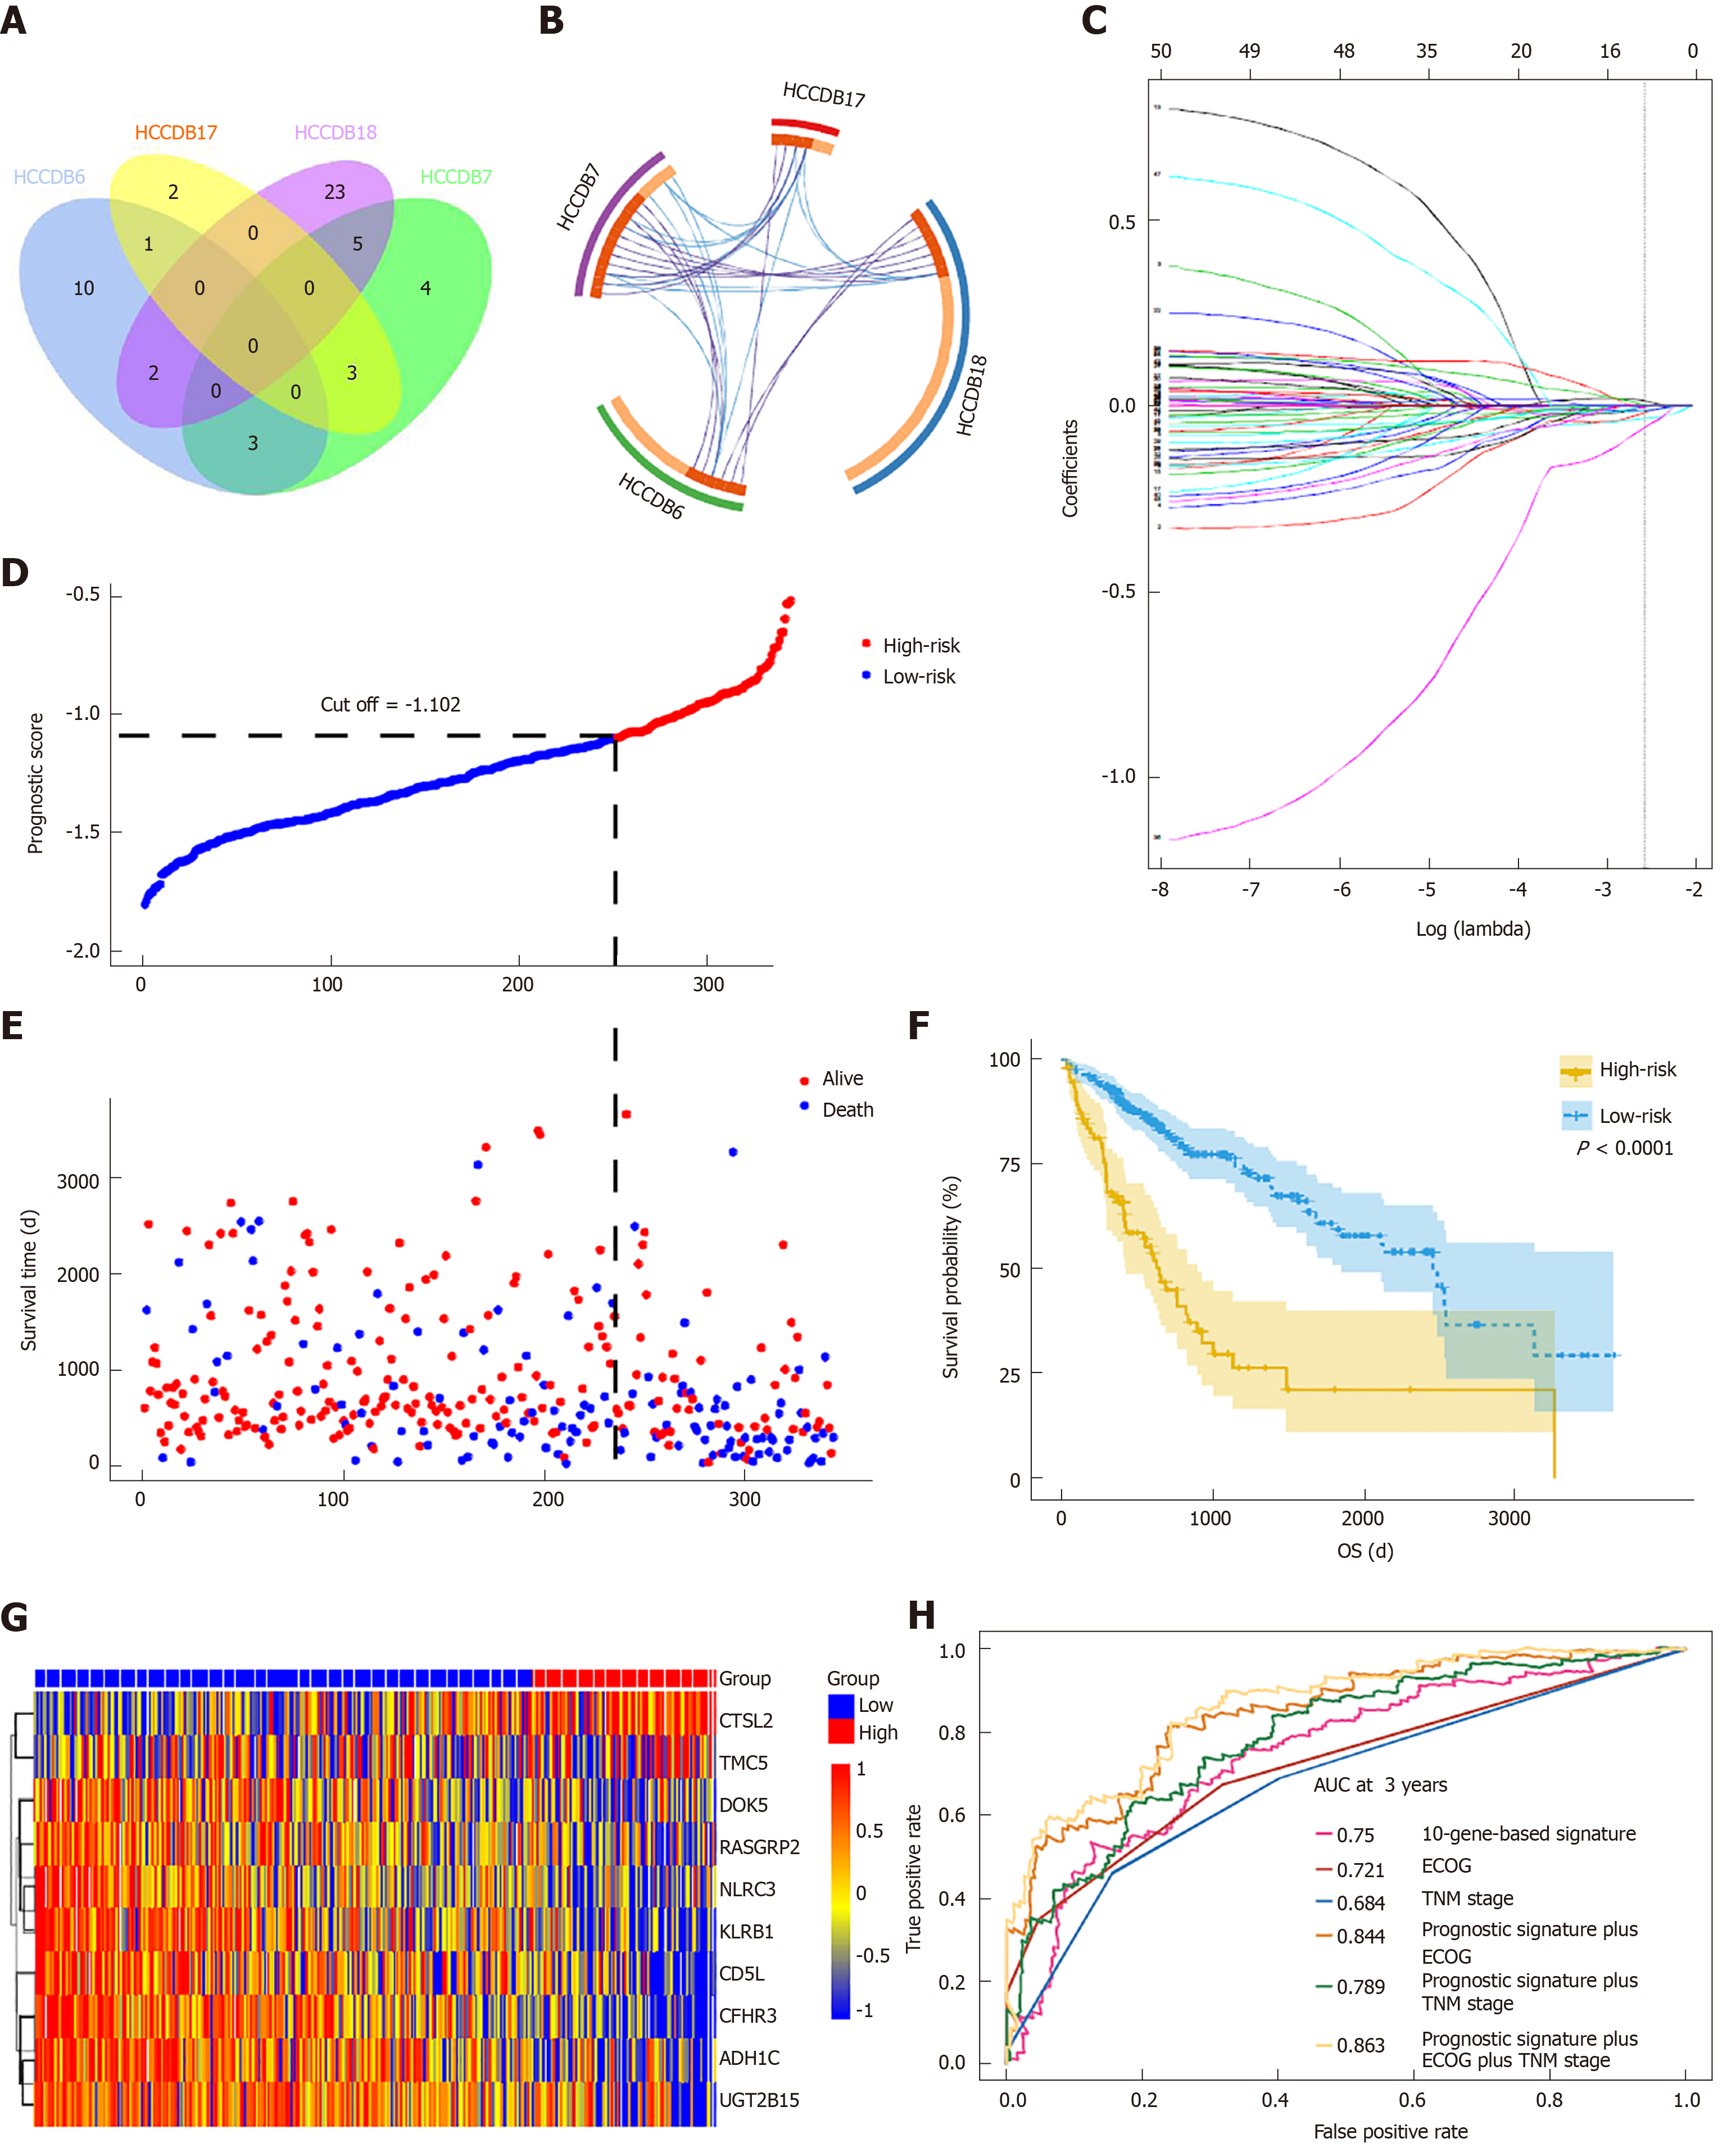
Figure 4 Prognosis-related differentially expressed genes validated in four additional cohorts and construction of the prognostic gene signature.
A: Venn diagram showing the results of genes validated in four cohorts; B: Circos plot showing overlapping genes between the four cohorts. Purple curves link identical genes while blue curves link genes that belong to the same enriched ontology term; C: LASSO coefficient profiles of 52 genes validated in four cohorts; D: Distribution of risk scores; E: Patients’ survival time and status. The black dotted line indicates the optimum cutoff dividing patients into low- and high-risk groups; (F) Kaplan-Meier curves for low- and high-risk groups; G: Heat map of ten key genes in the genes signature; H: Time-dependent receiver operating characteristic curves for comparing prediction accuracy among the ten-gene-based signature and clinicopathological features.
- Citation: Pan L, Fang J, Chen MY, Zhai ST, Zhang B, Jiang ZY, Juengpanich S, Wang YF, Cai XJ. Promising key genes associated with tumor microenvironments and prognosis of hepatocellular carcinoma. World J Gastroenterol 2020; 26(8): 789-803
- URL: https://www.wjgnet.com/1007-9327/full/v26/i8/789.htm
- DOI: https://dx.doi.org/10.3748/wjg.v26.i8.789


