Copyright
©The Author(s) 2020.
World J Gastroenterol. Feb 28, 2020; 26(8): 789-803
Published online Feb 28, 2020. doi: 10.3748/wjg.v26.i8.789
Published online Feb 28, 2020. doi: 10.3748/wjg.v26.i8.789
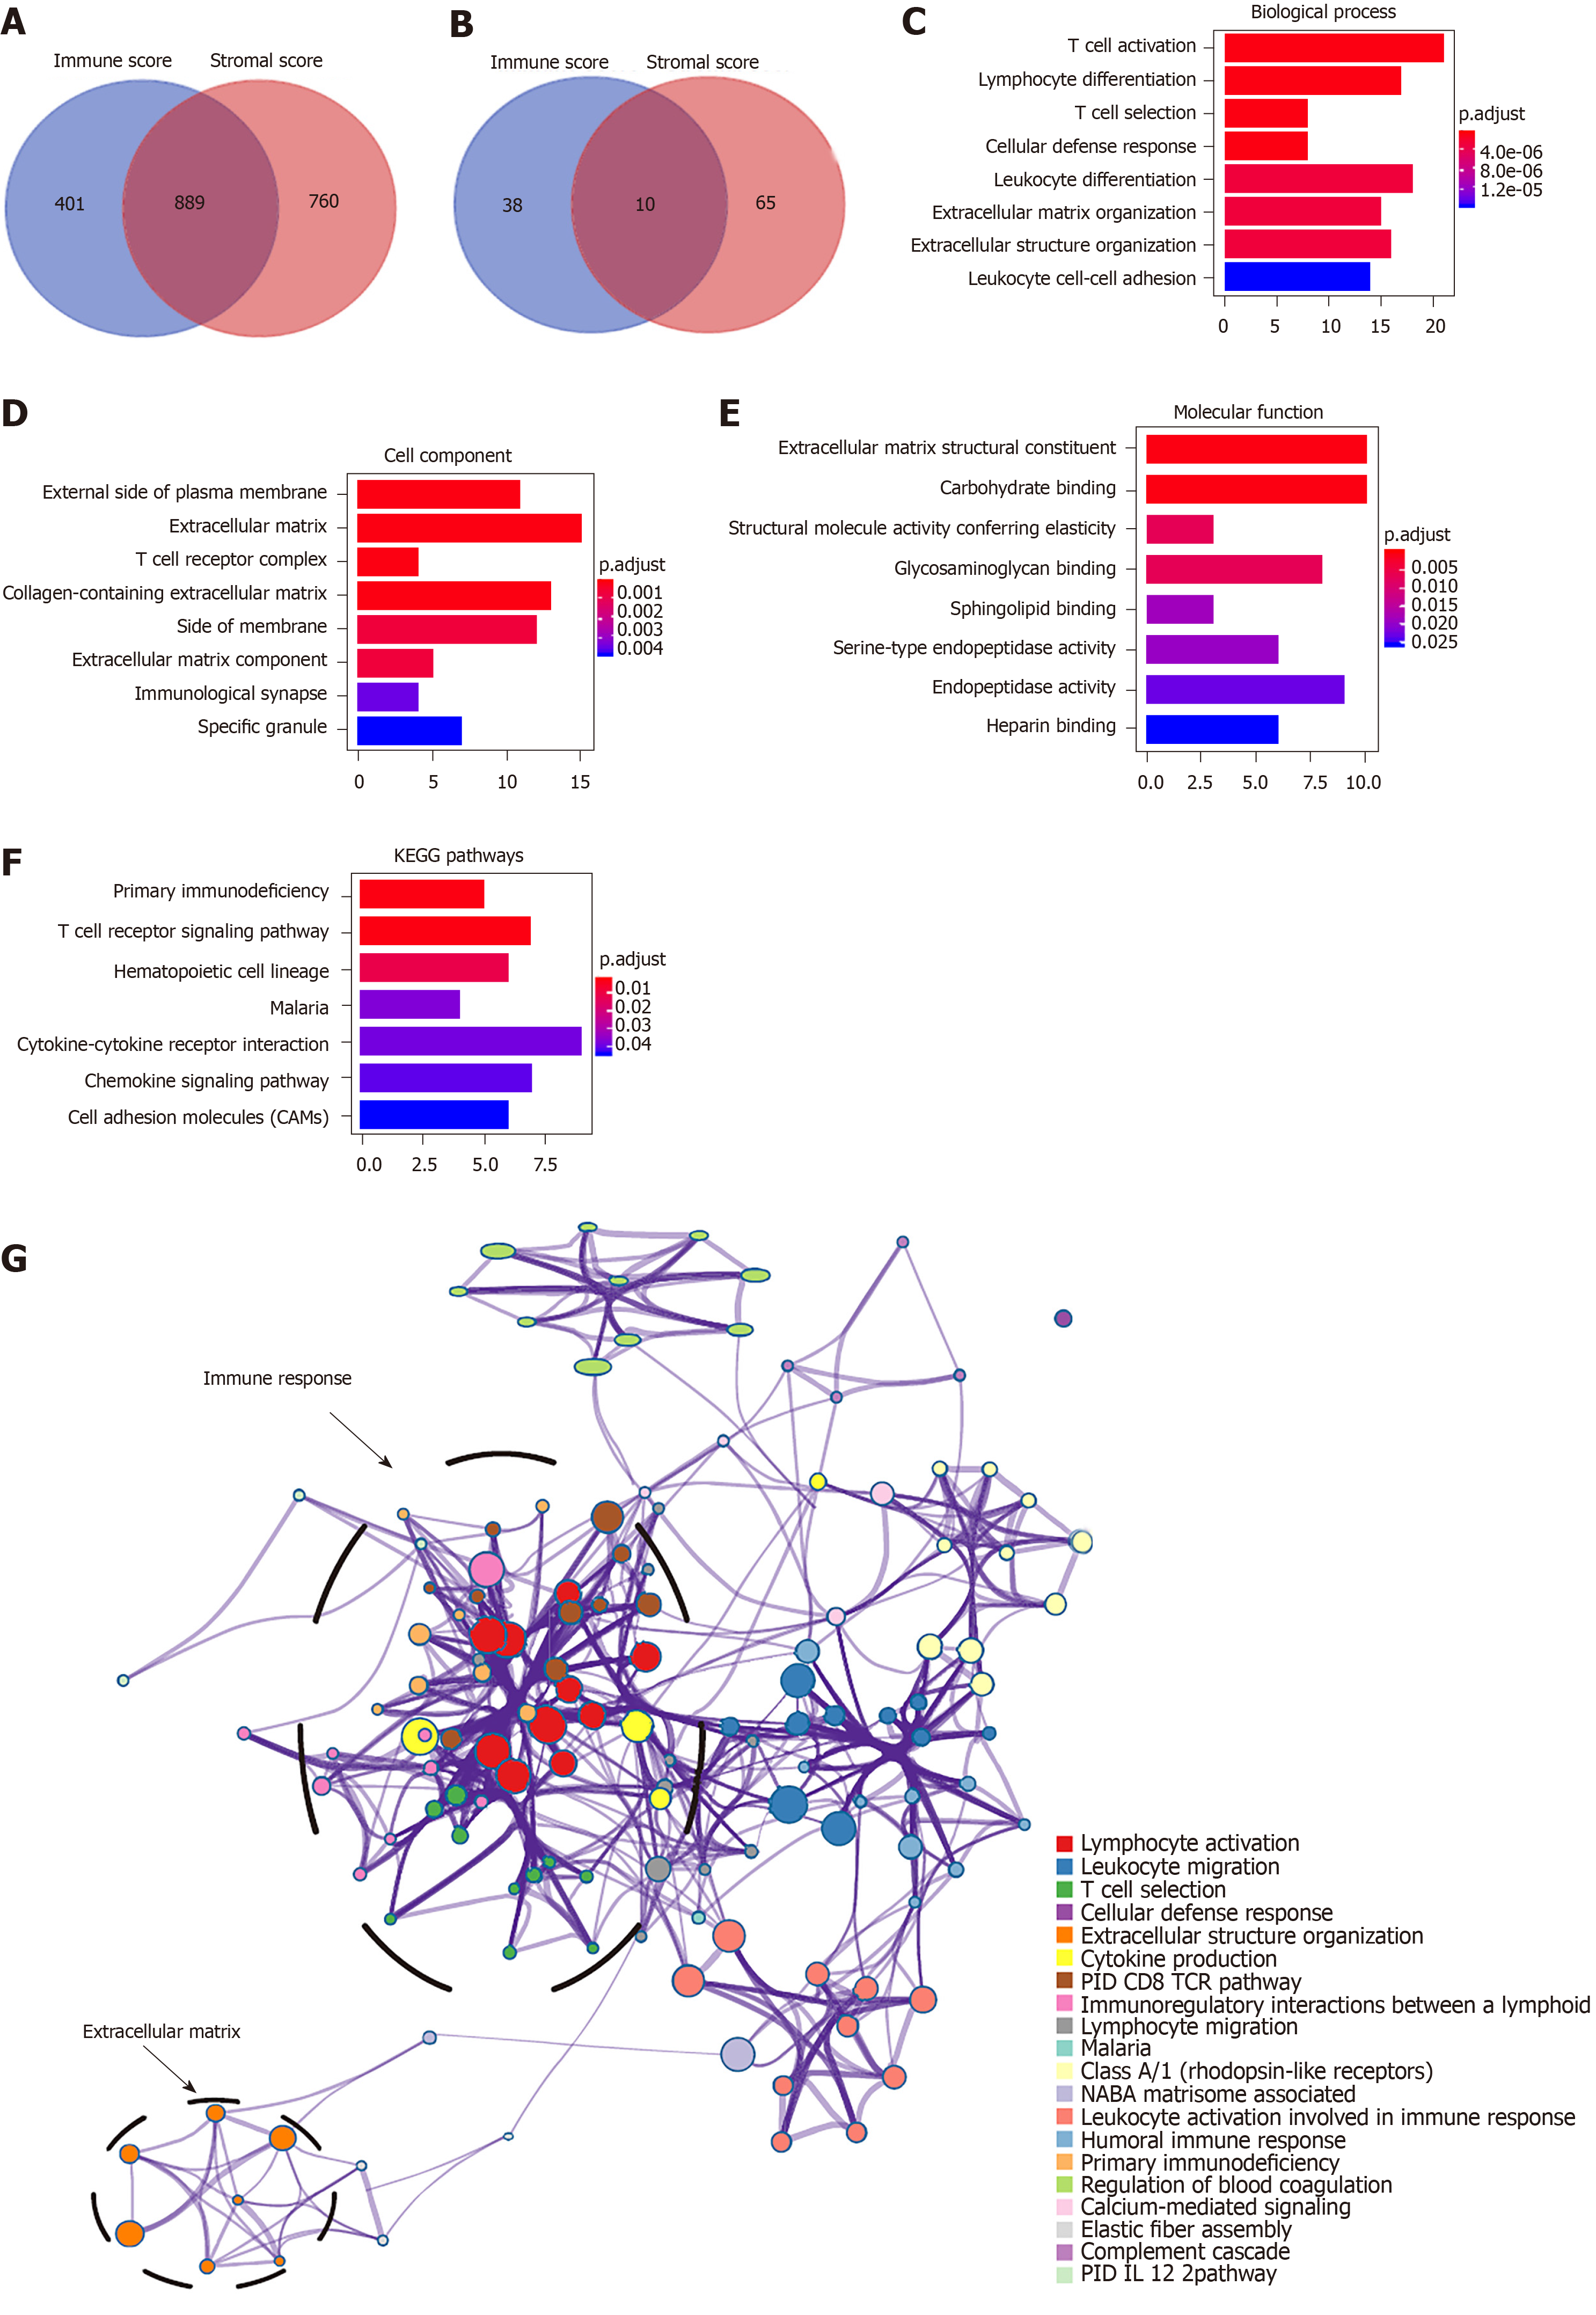
Figure 2 Pathway and process enrichment analysis of prognosis-related differentially expressed genes in hapetocellular carcinoma.
A and B: Venn diagrams showing the number of simutaneously downregulated (A) or upregulated (B) differentially expressed genes (DEGs) in immune or stromal score groups; C-F: Gene ontology terms and Kyoto Encyclopedia of Genes and Genomes (KEGG) pathway analysis across 147 DEGs with regard to (C) biological process, (D) cellular component, (E) molecular function, and (F) KEGG pathway. G: Network of enriched terms. Nodes that share the same terms are typically close to each other. KEGG: Kyoto Encyclopedia of Genes and Genomes.
- Citation: Pan L, Fang J, Chen MY, Zhai ST, Zhang B, Jiang ZY, Juengpanich S, Wang YF, Cai XJ. Promising key genes associated with tumor microenvironments and prognosis of hepatocellular carcinoma. World J Gastroenterol 2020; 26(8): 789-803
- URL: https://www.wjgnet.com/1007-9327/full/v26/i8/789.htm
- DOI: https://dx.doi.org/10.3748/wjg.v26.i8.789


