Copyright
©The Author(s) 2020.
World J Gastroenterol. Feb 14, 2020; 26(6): 614-626
Published online Feb 14, 2020. doi: 10.3748/wjg.v26.i6.614
Published online Feb 14, 2020. doi: 10.3748/wjg.v26.i6.614
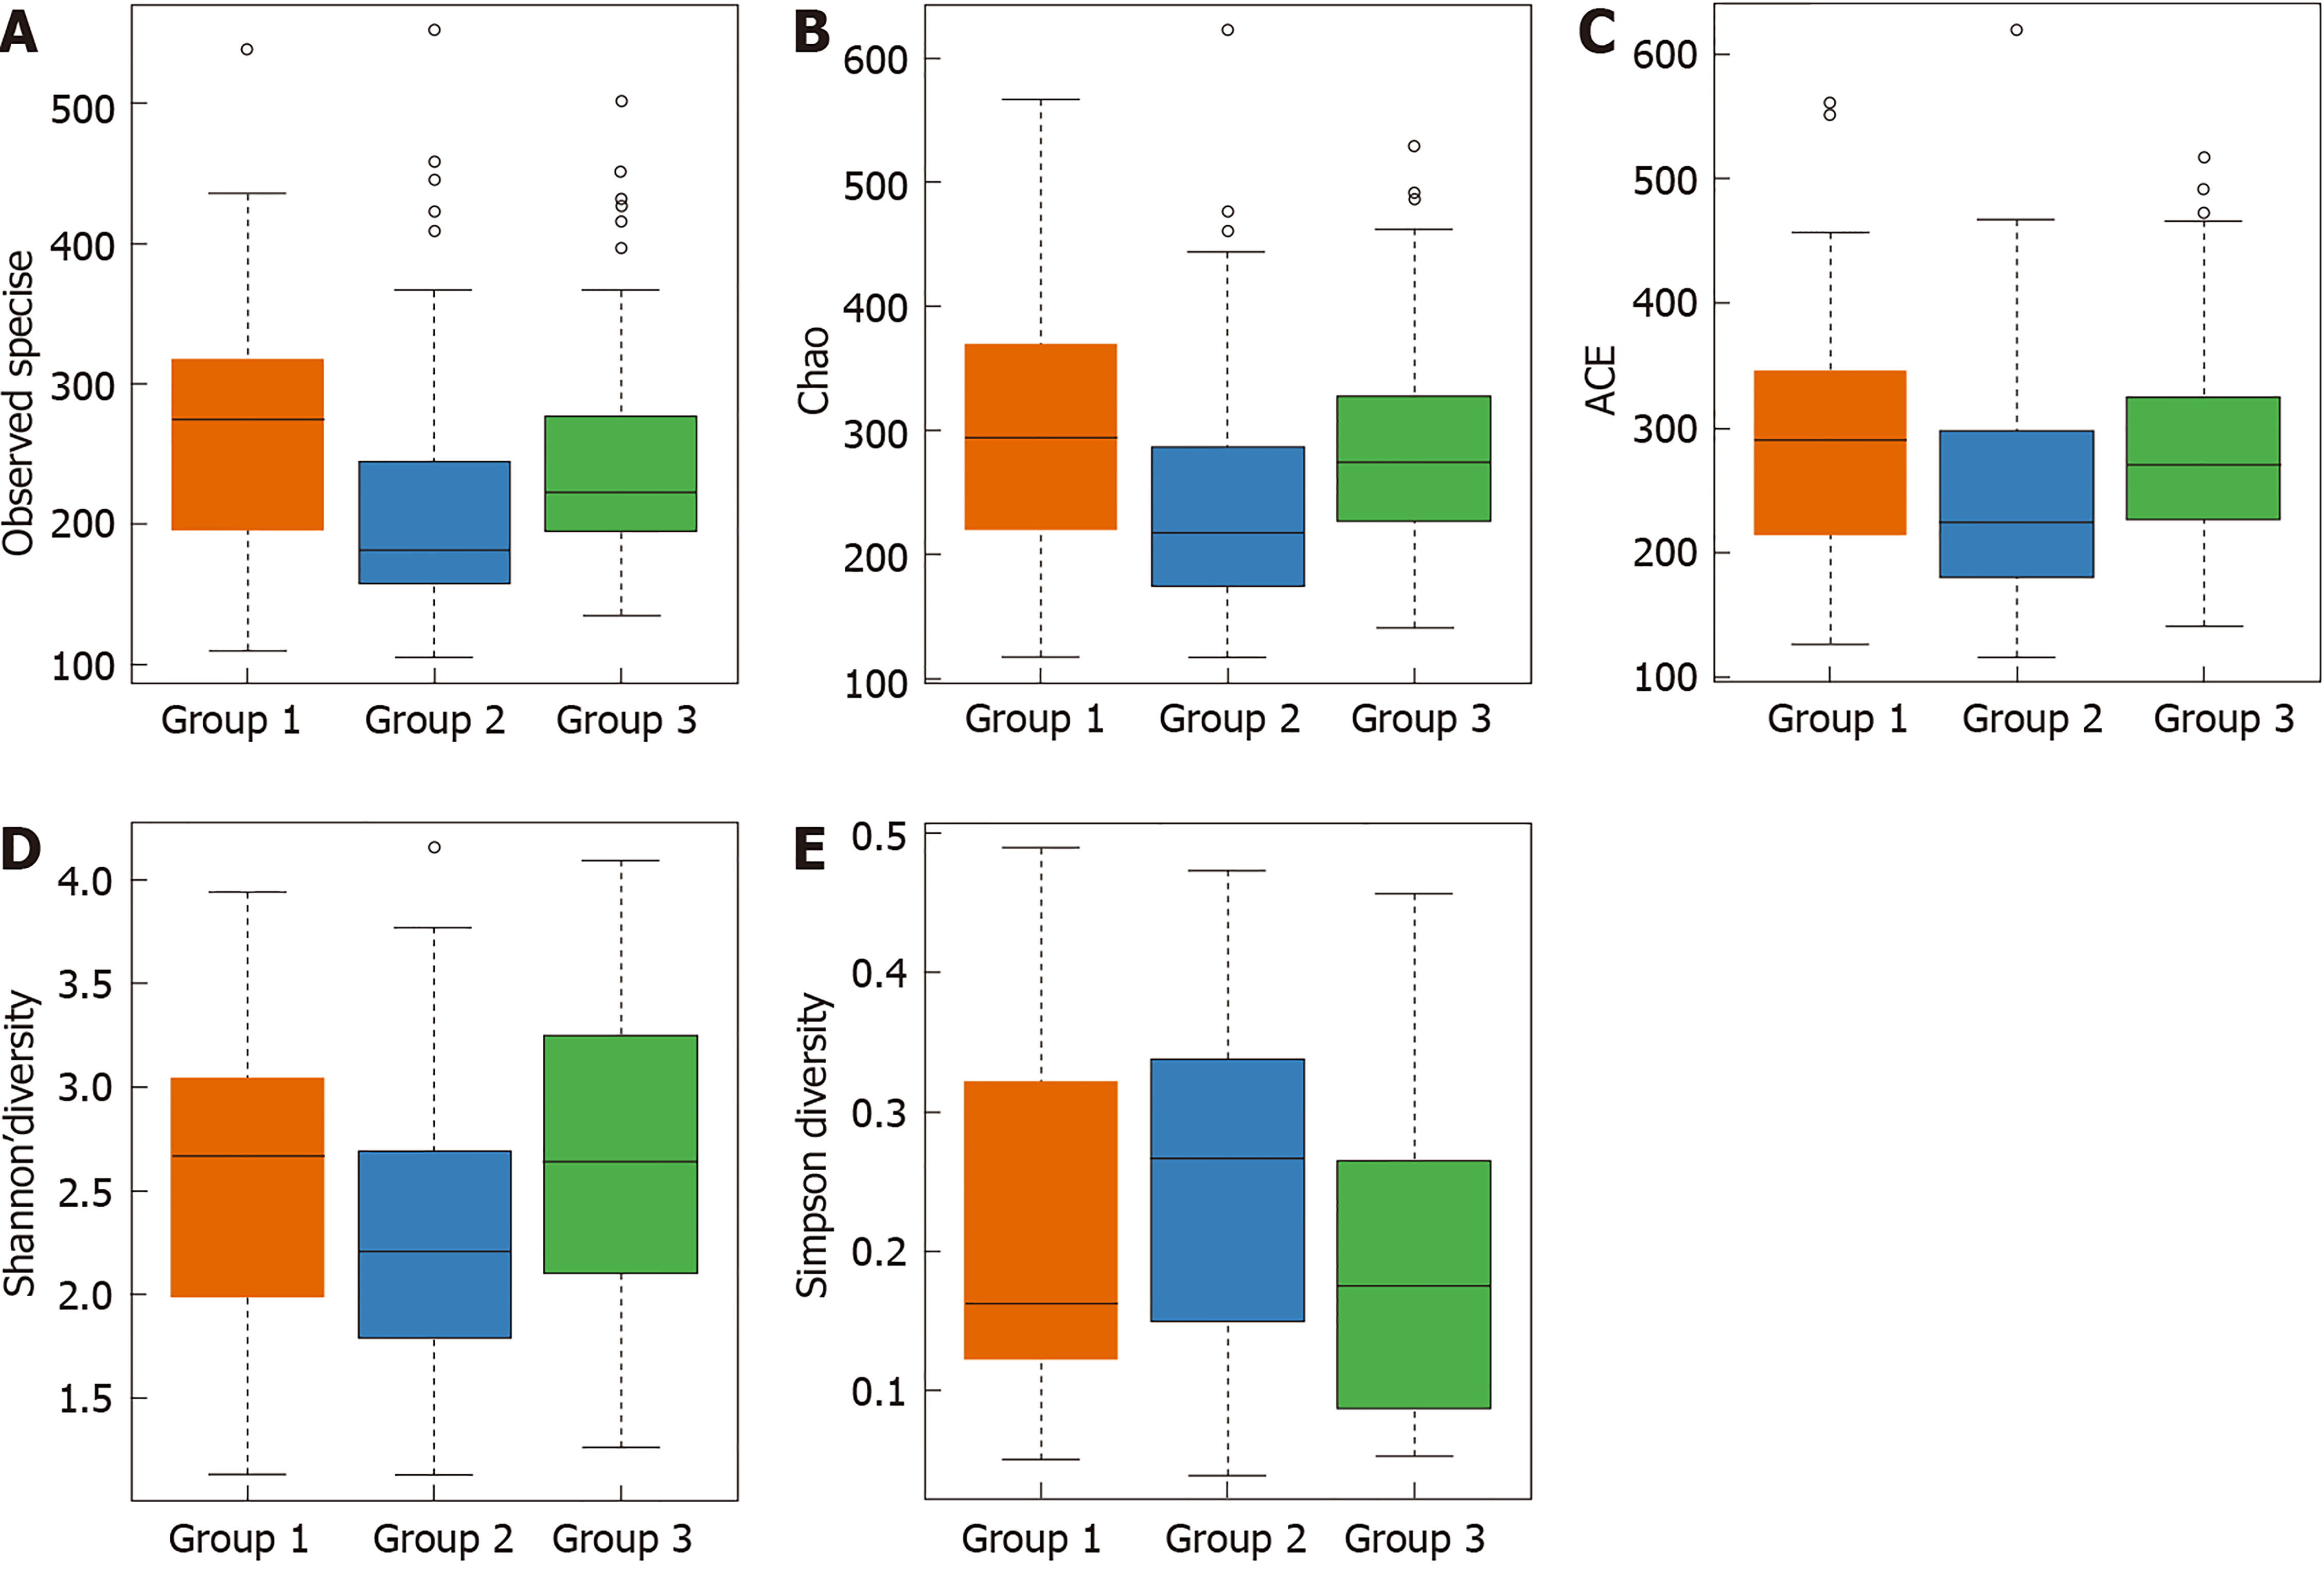
Figure 2 Box plots of alpha diversity among normal mucosa (group 1), colorectal adenoma mucosa (group 2), and adjacent normal mucosa of colorectal adenoma specimens (group 3).
A: Differences in the observed operational taxonomic units among normal mucosa (group 1), colorectal adenoma (CRA) mucosa (group 2), and adjacent normal mucosa of CRA specimens (group 3); B: Differences in Chao among normal mucosa (group 1), CRA mucosa (group 2), and adjacent normal mucosa of CRA specimens (group 3); C: Differences in the index used to estimate the number of OTU in the community among normal mucosa (group 1), CRA mucosa (group 2), and adjacent normal mucosa of CRA specimens (group 3); D: Differences in the Shannon index among normal mucosa (group 1), CRA mucosa (group 2), and adjacent normal mucosa of CRA specimens (group 3); E: Differences in the Simpson diversity index among normal mucosa (group 1), CRA mucosa (group 2), and adjacent normal mucosa of CRA specimens (group 3). ACE: Index used to estimate the number of OTU in the community.
- Citation: Wang WJ, Zhou YL, He J, Feng ZQ, Zhang L, Lai XB, Zhou JX, Wang H. Characterizing the composition of intestinal microflora by 16S rRNA gene sequencing. World J Gastroenterol 2020; 26(6): 614-626
- URL: https://www.wjgnet.com/1007-9327/full/v26/i6/614.htm
- DOI: https://dx.doi.org/10.3748/wjg.v26.i6.614


