Copyright
©The Author(s) 2020.
World J Gastroenterol. Feb 7, 2020; 26(5): 478-498
Published online Feb 7, 2020. doi: 10.3748/wjg.v26.i5.478
Published online Feb 7, 2020. doi: 10.3748/wjg.v26.i5.478
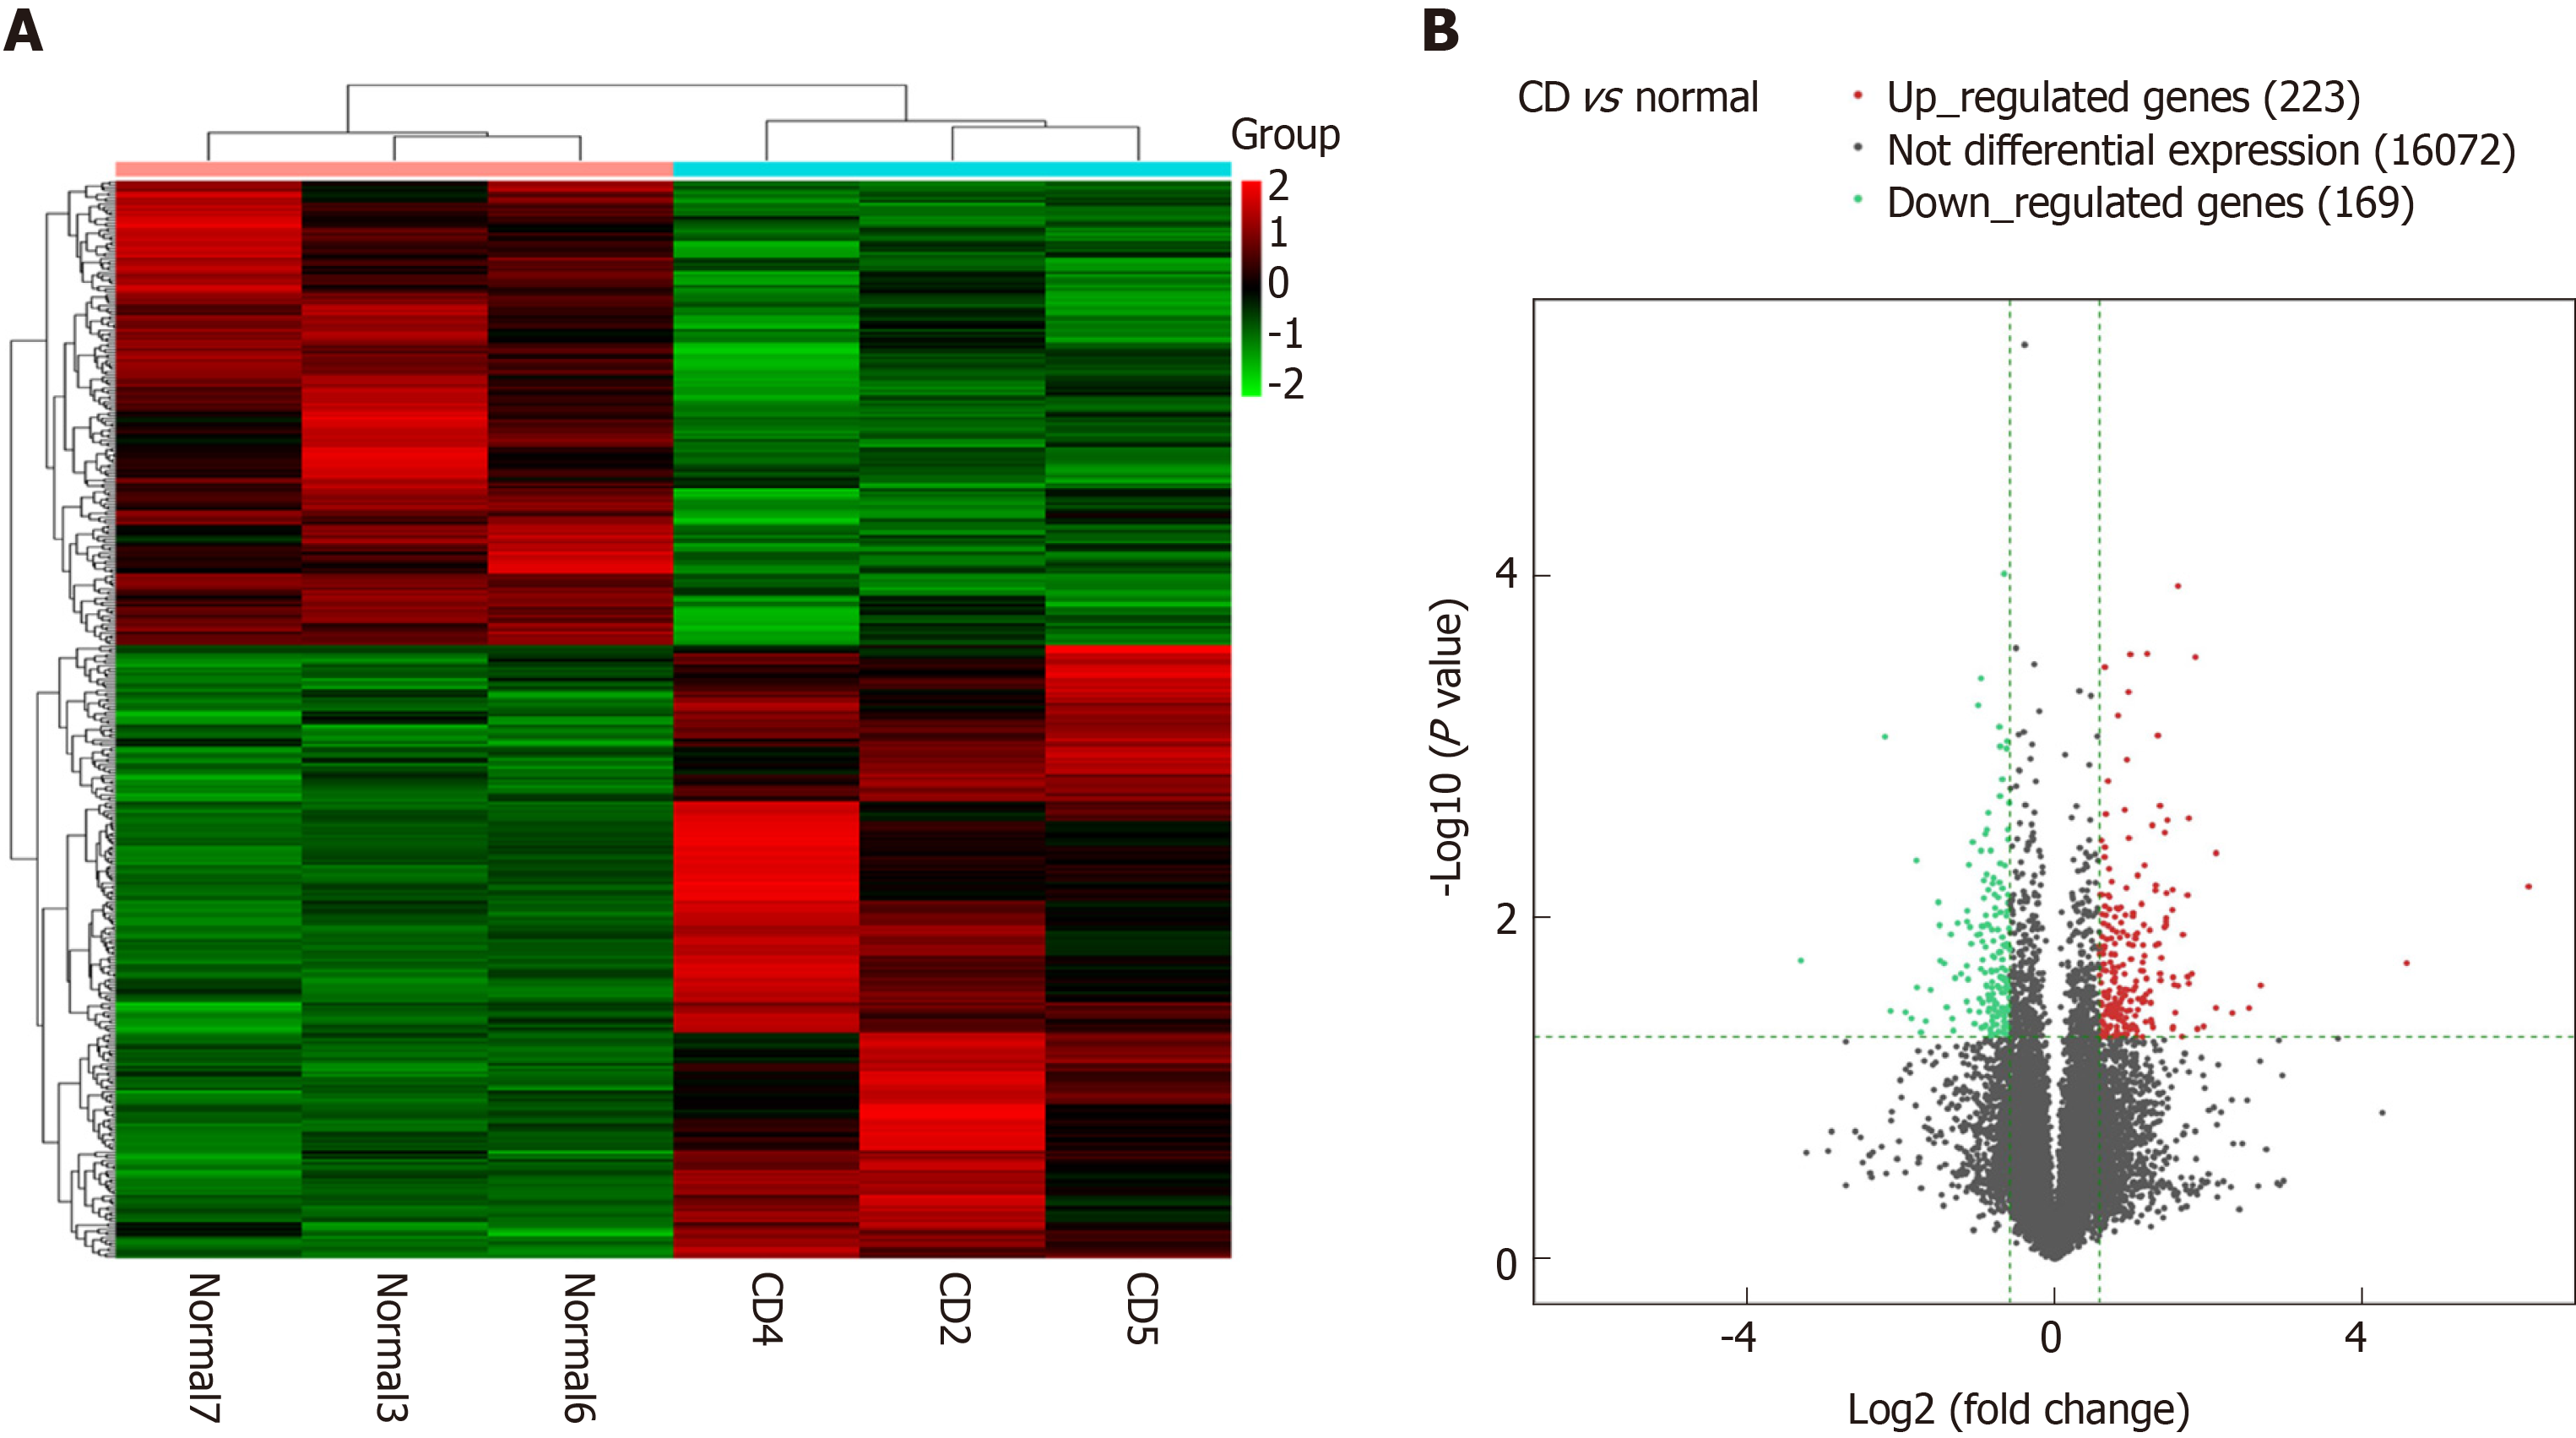
Figure 1 Cluster analysis of differentially expressed long noncoding RNAs.
A: Thermograms of differentially expressed long noncoding RNAs (lncRNAs) in the intestinal mucosa from Crohn’s disease patients (three samples on right) compared to normal intestinal mucosa from control subjects (three samples on left). Each row represents one gene, and each column represents one sample. Red color represents genes with significantly upregulated expression, and green color represents genes with significantly downregulated expression; B: Differentially expressed lncRNAs shown in a volcano plot. The X-axis represents log2-fold changes, and the Y-axis represents log10 P values, for each significantly altered lncRNA. The two vertical green lines are up- and down-sets, and the green horizontal lines represent the P-value threshold. The red dots represent genes with significantly upregulated expression. The green dots represent genes with significantly downregulated expression. The gray dots represent genes without significant changes in expression.
- Citation: Li N, Shi RH. lncRNACNN3-206 activates intestinal epithelial cell apoptosis and invasion by sponging miR-212, an implication for Crohn's disease. World J Gastroenterol 2020; 26(5): 478-498
- URL: https://www.wjgnet.com/1007-9327/full/v26/i5/478.htm
- DOI: https://dx.doi.org/10.3748/wjg.v26.i5.478


